
Average Mean Wave: Measuring the “Typical” Push After Every Reversion
Series: Public Roadmap to Fractal Mastery – Part 7

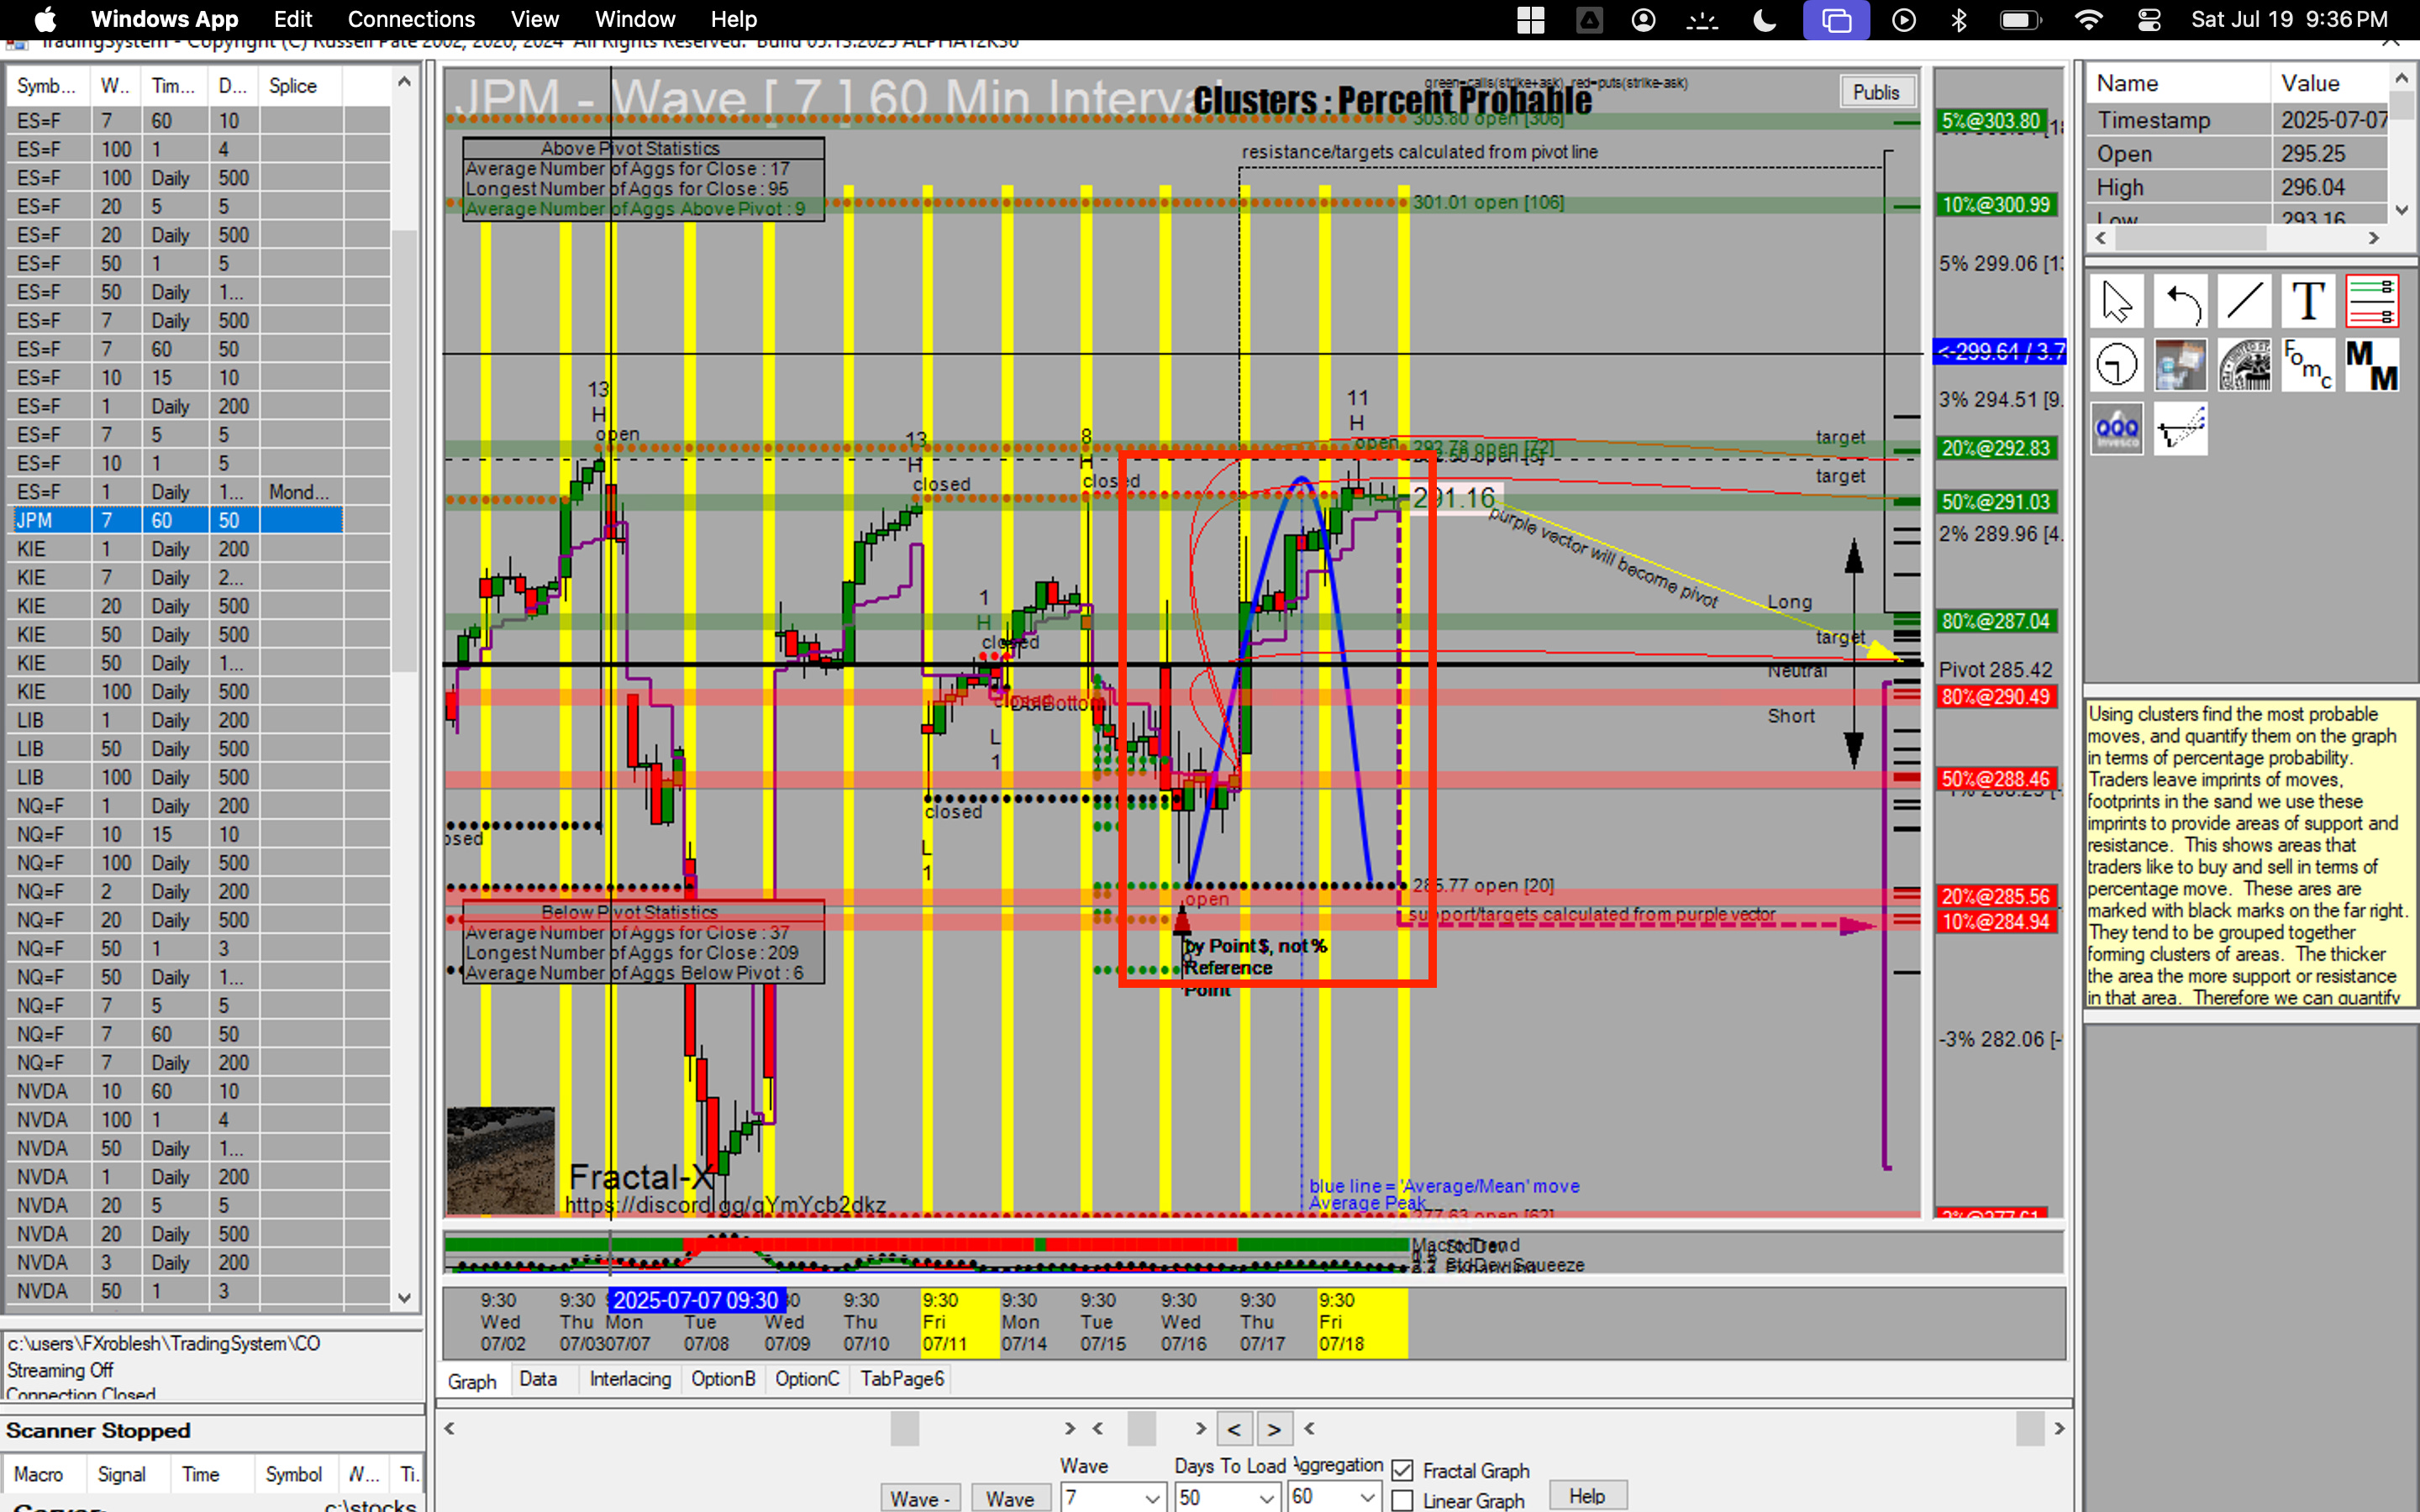
The vector tells us where new cycles can start. HL Values measure effort. Probability Bands visualize odds of extension. The next puzzle piece is the Average Mean Wave (AMW)—a blue parabola that shows how far price normally travels from a reversion before stalling.
What Is the Average Mean Wave?
When you enable AMW, the Fractal plots a blue arc that begins at the most recent reversion point and peaks at the average historical distance of past cycles - BUT, its forward-looking.
Starting Point: The last HL value when a high or low was set in.
Peak: The price level that past cycles, on average, reached before reversing or consolidating.
Shape: A gentle parabola so your eye instantly sees whether current momentum is weaker, equal, or stronger.
Why AMW Matters
Baseline Expectation – Know the “typical” move length instead of guessing.
Strength Gauge – Price lagging below the arc = weak trend; blowing past arc = outlier strength.
Target Calibration – Pair AMW with probability bands to set magnetic profit targets.
Practical Uses
Re‑Entry Flag
If price retests the vector and AMW hasn’t been met, look to reload in‑trend.
Trim or Trail
When price tags the AMW peak and OA bias softens, tighten stops or take profits.Parabolic Potential

If price exceeds AMW and breaks a stacked imprint while MM Floor/Ceiling extends, prepare for an outlier run.
AMW + Probability Bands + Open States
Vector Cross ➜ OA Bullish ➜ Open State ➜ AMW Peak aligns with 50 % Band
High‑conviction target; take 75 % off there.Price exceeds AMW + 5 % Band In View + Open State + OA still strong
You’re in potential “blue‑sky” territory; let runners breathe but trail aggressively.
Common Pitfalls
Anchoring Bias – Assuming every cycle must reach the AMW. The AMW is a guideline, not a guarantee.
Over‑confidence – Betting big on outlier continuation without confirming MM levels or OA bias.
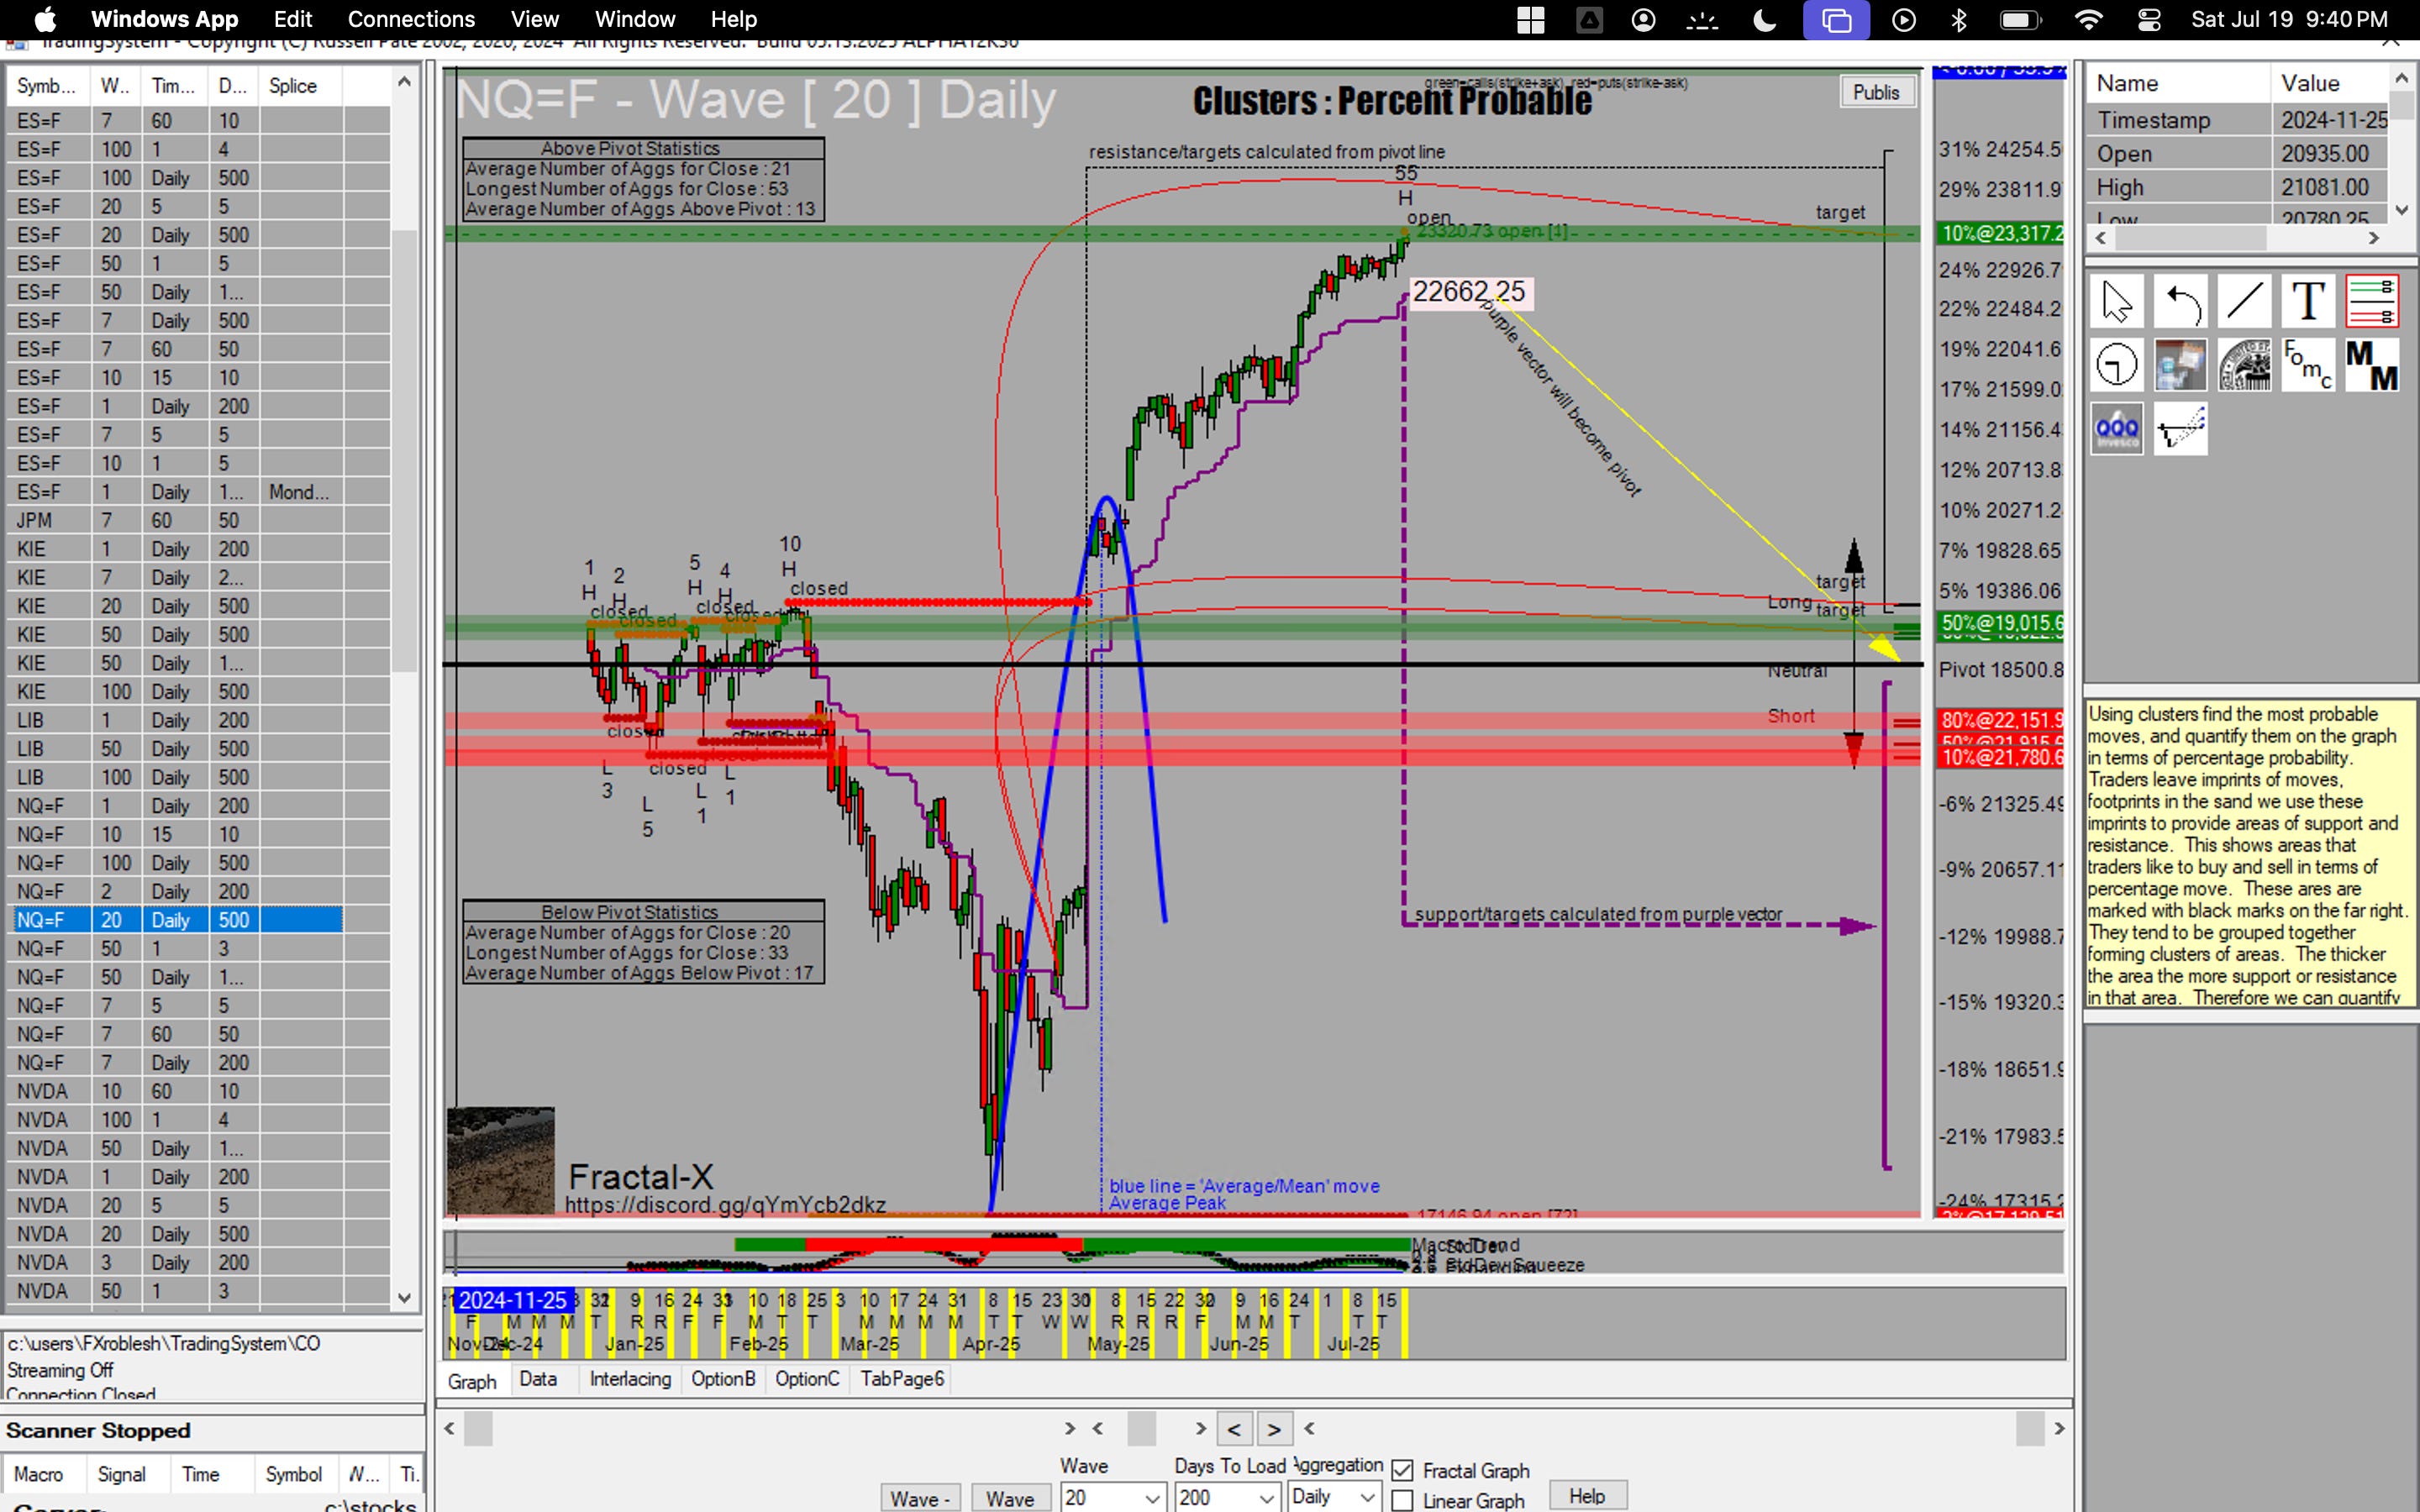
Ignoring Timeframe Context – A smaller timeframe (like 15 minute) average mean wave move is small compared to a daily average mean wave move
Quick Checklist Before Each Trade
Identify recent pivot cross and note AMW peak distance.
Check which probability band overlaps (if any).
Confirm OA bias and nearby Open‑State levels.
Plan exits: Base at AMW starting point, Stretch at next probability band or MM level.
Coming Up
Part 8 will showcase the Open State feature of the Fractal, one of my favorite features.
Ready to stop guessing how far a move can go? Let the Average Mean Wave set realistic—and occasionally explosive—targets for every cycle.
Confirmed