
Forward-Looking Standard Deviation: Anticipating Market Volatility with Precision
Series: Public Roadmap to Fractal Mastery – Part 8. You spoke. We listened.

Due to popular demand from the TradeWellX Discord survey, I moved up the lesson on the standard deviation tool to this week. So here it is…
Traders often rely on standard deviation tools to measure market volatility.
However, traditional standard deviation indicators tend to lag, reflecting past price behavior rather than providing actionable, predictive insights.
The Fractal's forward-looking standard deviation tool flips this script, allowing you to anticipate and capitalize on future market movements.

Lagging vs. Leading Indicators: Understanding the Difference
Most standard deviation tools traders use, like Bollinger Bands, rely heavily on historical data, thus reacting slowly to current market conditions. Conversely, leading indicators, like the Fractal's forward-looking standard deviation, use predictive analytics to offer real-time insights, equipping traders to make timely, data-driven decisions.
Even Hedge Funds Know…
Hedge funds, including industry leaders like Renaissance Technologies and Two Sigma, have long employed statistical, predictive methods in their trading strategies. These sophisticated firms consistently outperform the market precisely because they anticipate volatility and directional shifts before they become evident to the wider market. (Source: Institutional Investor)
Here It Is: The Fractal, Forward-Looking, Standard Deviation Tool Explained
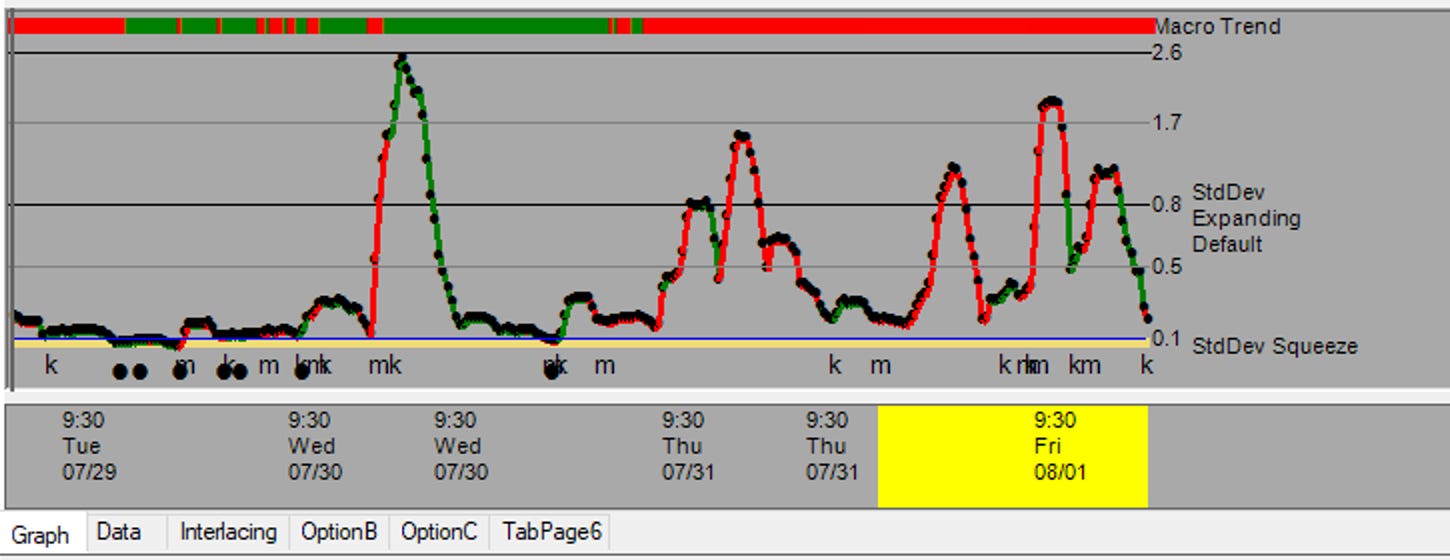
This powerful Fractal tool, integrated into every chart and timeframe, visually indicates anticipated market movements and volatility through:
Compressed Range (<0.1 aka Squeeze Zone): Indicates incoming “explosive” behavior. This is vital for anticipating large moves either to the upside or downside…and you can know with high probability where it will go beforehand.
Compressed Range (0.1 to 0.5): Indicates tight consolidation. Price is likely range-bound, signaling lower volatility and cautionary trading conditions (price could “float”).
Breakout Signal (Above 0.5-0.8): When values surpass 0.5, expect expanding volatility, preparing for larger, directional moves (sometimes even both directions aggressively in a short period of time.
Aggressive Push Indicators (1.6+): Highlight extreme velocity, suggesting imminent significant market movements (often catalyzed by a news drop detected BEFOREHAND).
Directional Bias Indicators: Letters "m" and "k" provide immediate directional cues—"m" signals strong downward momentum accompanied by a red macro trend bar for further confluence, and "k" denotes upward momentum with a green macro trend bar for further confluence. You can visualize whether the momentum is countertrend as well by looking at the difference of the curve color and the macro trend bar.
Practical Applications: Trading with Predictive Volatility
Using the forward-looking standard deviation tool effectively can help traders:
Identify Range-Bound Markets Early: Use the compressed range values (0.1-0.5) to determine when to reduce trading size and anticipate limited price movements.
Prepare for Breakouts: Position for potential breakout moves once the standard deviation indicator surpasses 0.5.
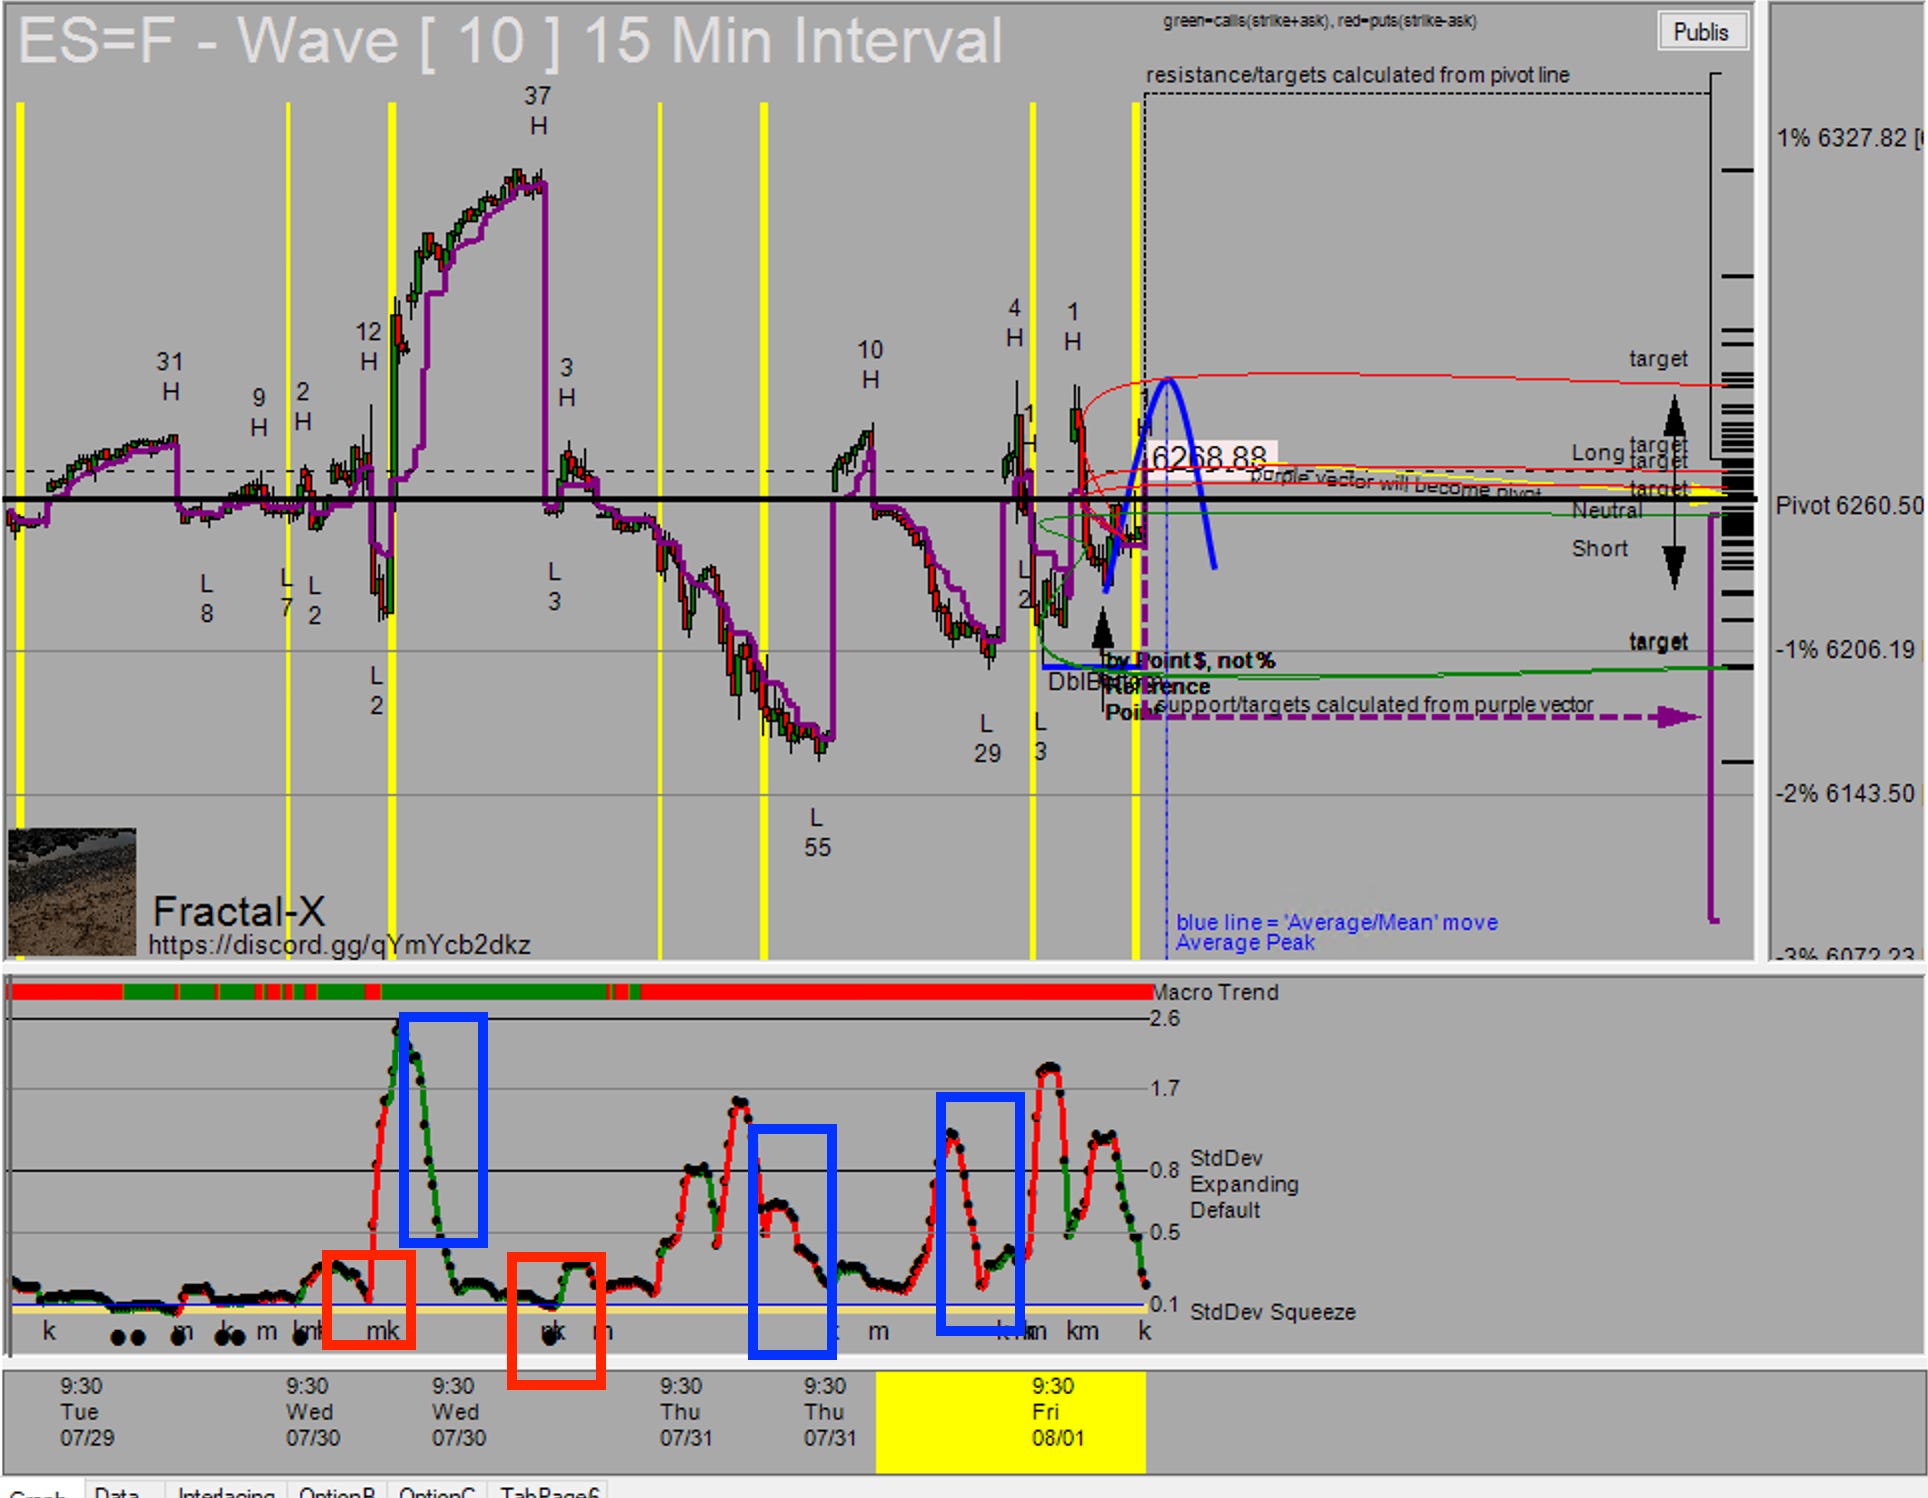
Capitalize on Aggressive Moves: Values above 1.6 to 2.6 signal strong market momentum, indicating likely continuation, but look for “slowing down”.
Manage Ongoing Trades: Identify when aggressive moves are losing momentum and use this data to adjust positions proactively.
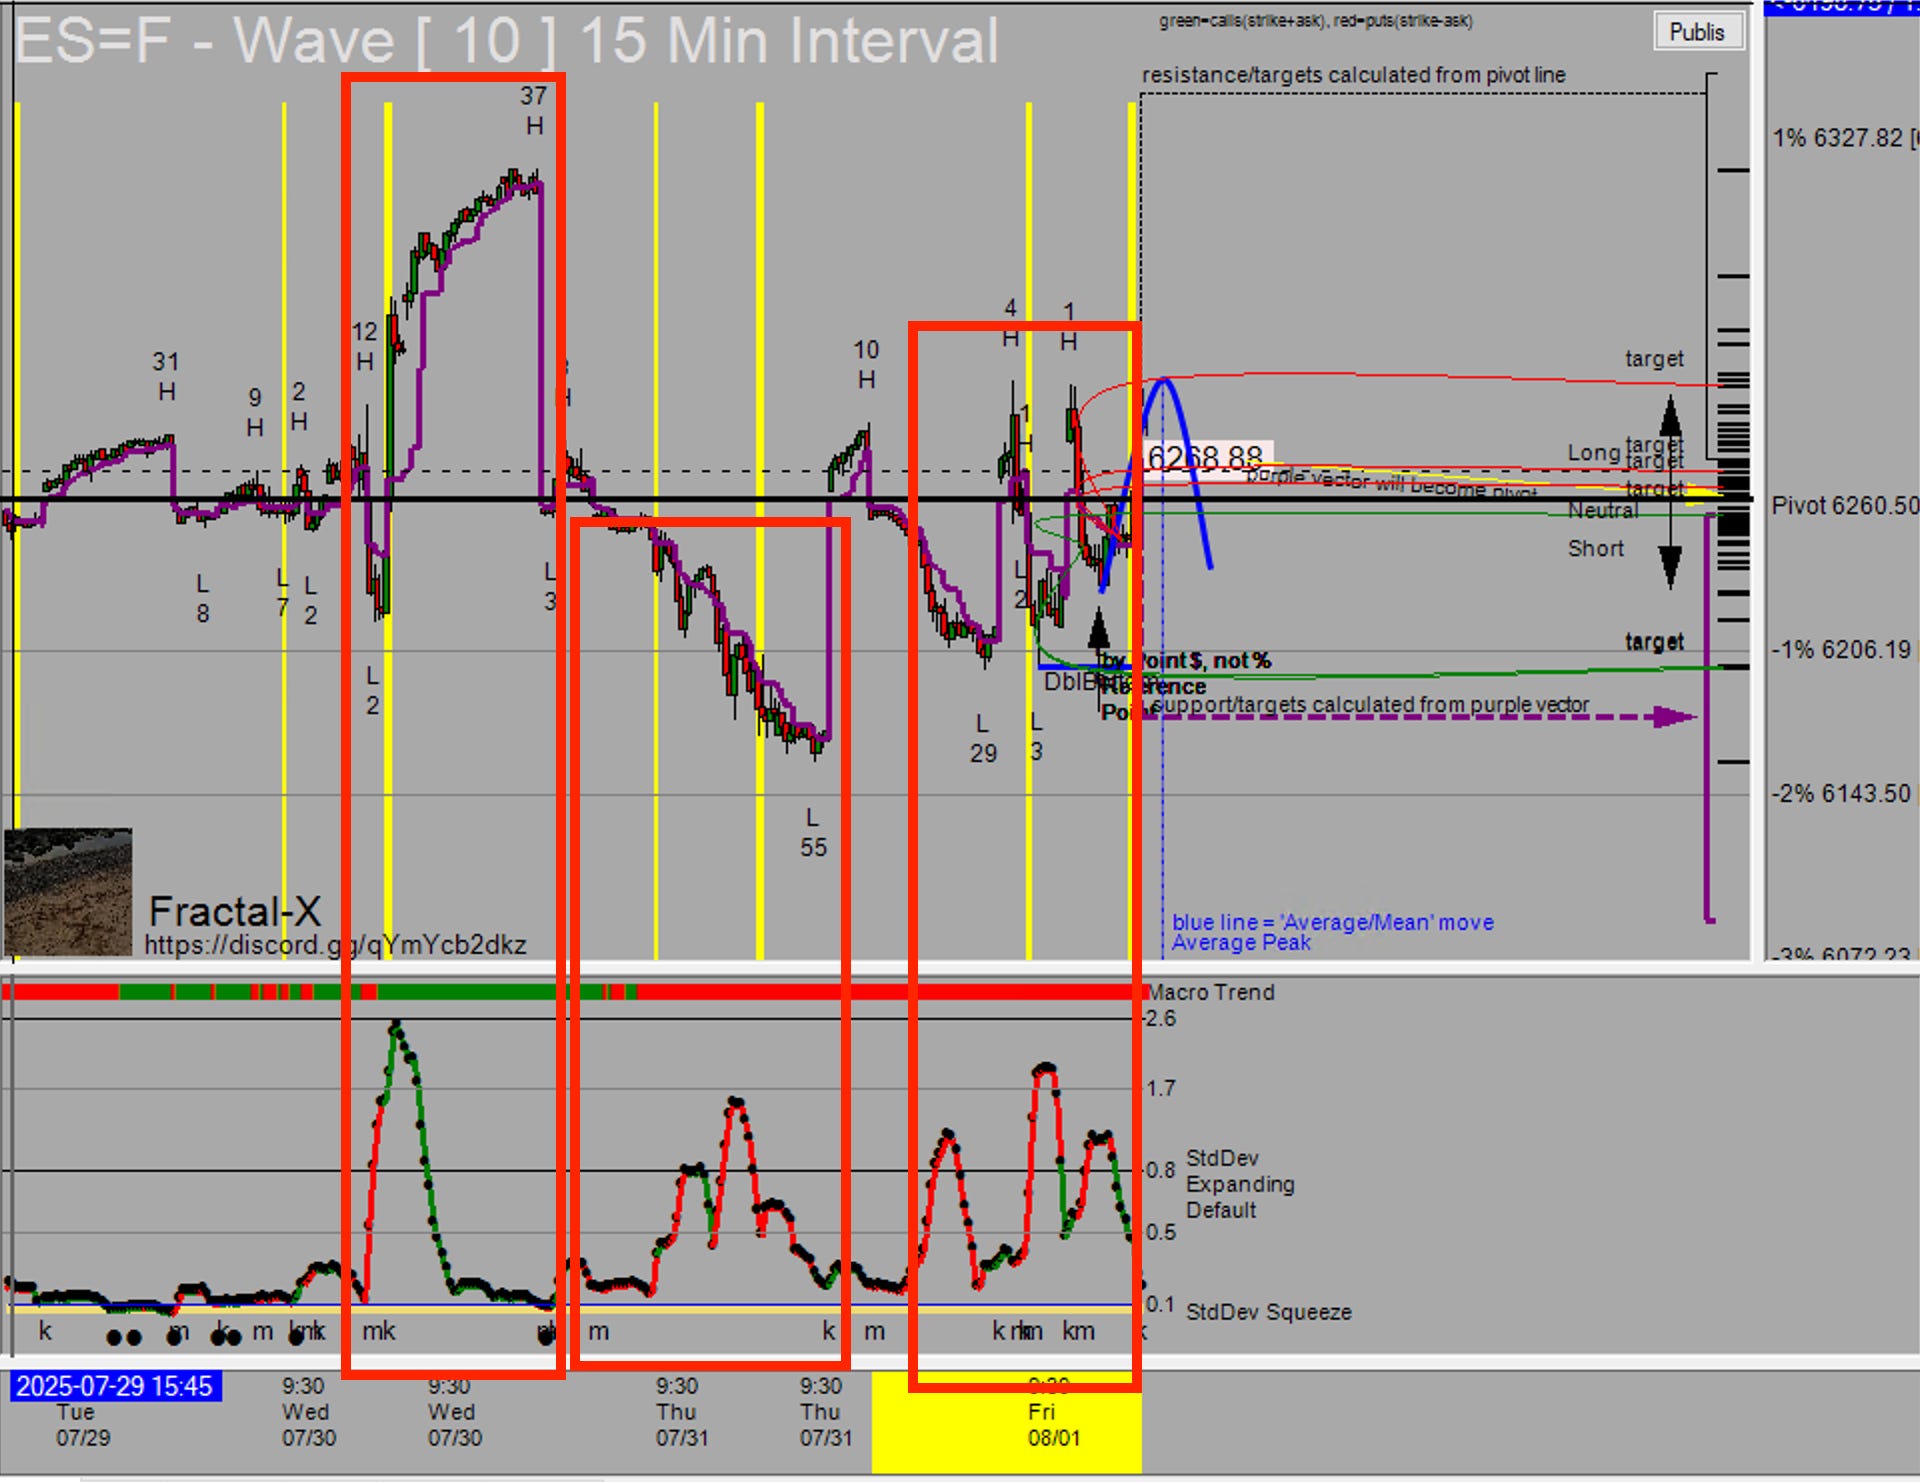
Notice in the screenshot above, how massive moves were detected BEFOREHAND, when the tool registered price entering into the yellow “squeeze” zone.
Similarly, the system could detect when the aggression was slowing down in price action.
Tip: Use the colors and bottom letters to help identify direction (long or short). Use the direction and value of the slope to identify aggression.
Common Pitfalls to Avoid
Relying Solely on Lagging Indicators: Traders depending exclusively on traditional, backward-looking volatility measures risk missing opportunities or reacting too late.
Ignoring Directional Bias Cues ("m" and "k"): Not aligning trades with directional bias indicators can lead to trading against prevailing momentum.
Key Takeaways
Leverage the predictive capabilities of the Fractal's forward-looking standard deviation tool to anticipate volatility and market direction.
Align your strategy with clearly indicated directional signals to trade with confidence and clarity.
Adopt a hedge fund approach—trading proactively rather than reactively, guided by quantifiable, forward-looking data.
By incorporating predictive volatility analysis into your trading routine, you position yourself to consistently stay ahead of market moves, making strategic decisions supported by robust statistical insights.
Understood that 'm' denotes move towards down and 'k' the other way. However I do see 'km' or 'mk' together and when that happens just stay away?
Also moosebot doesn't show these and there is no way for me to zoom the charts like you do. Do I have to get the Fractal system for it?
This one is clearly explained and now I can use fractal charts with ease. Thank you.