
Probability Bands: Visualizing Odds on the Fractal Chart
Series: Public Roadmap to Fractal Mastery – Part 6

The vector tells you where price can pivots. HL Values tell you how much effort a cycle expends. The Option Analyzer shows who is leaning into what direction. But how do you quickly see the likelihood that price will stretch to a specific target after crossing the pivot?
Enter Probability Bands.
What Are Probability Bands?
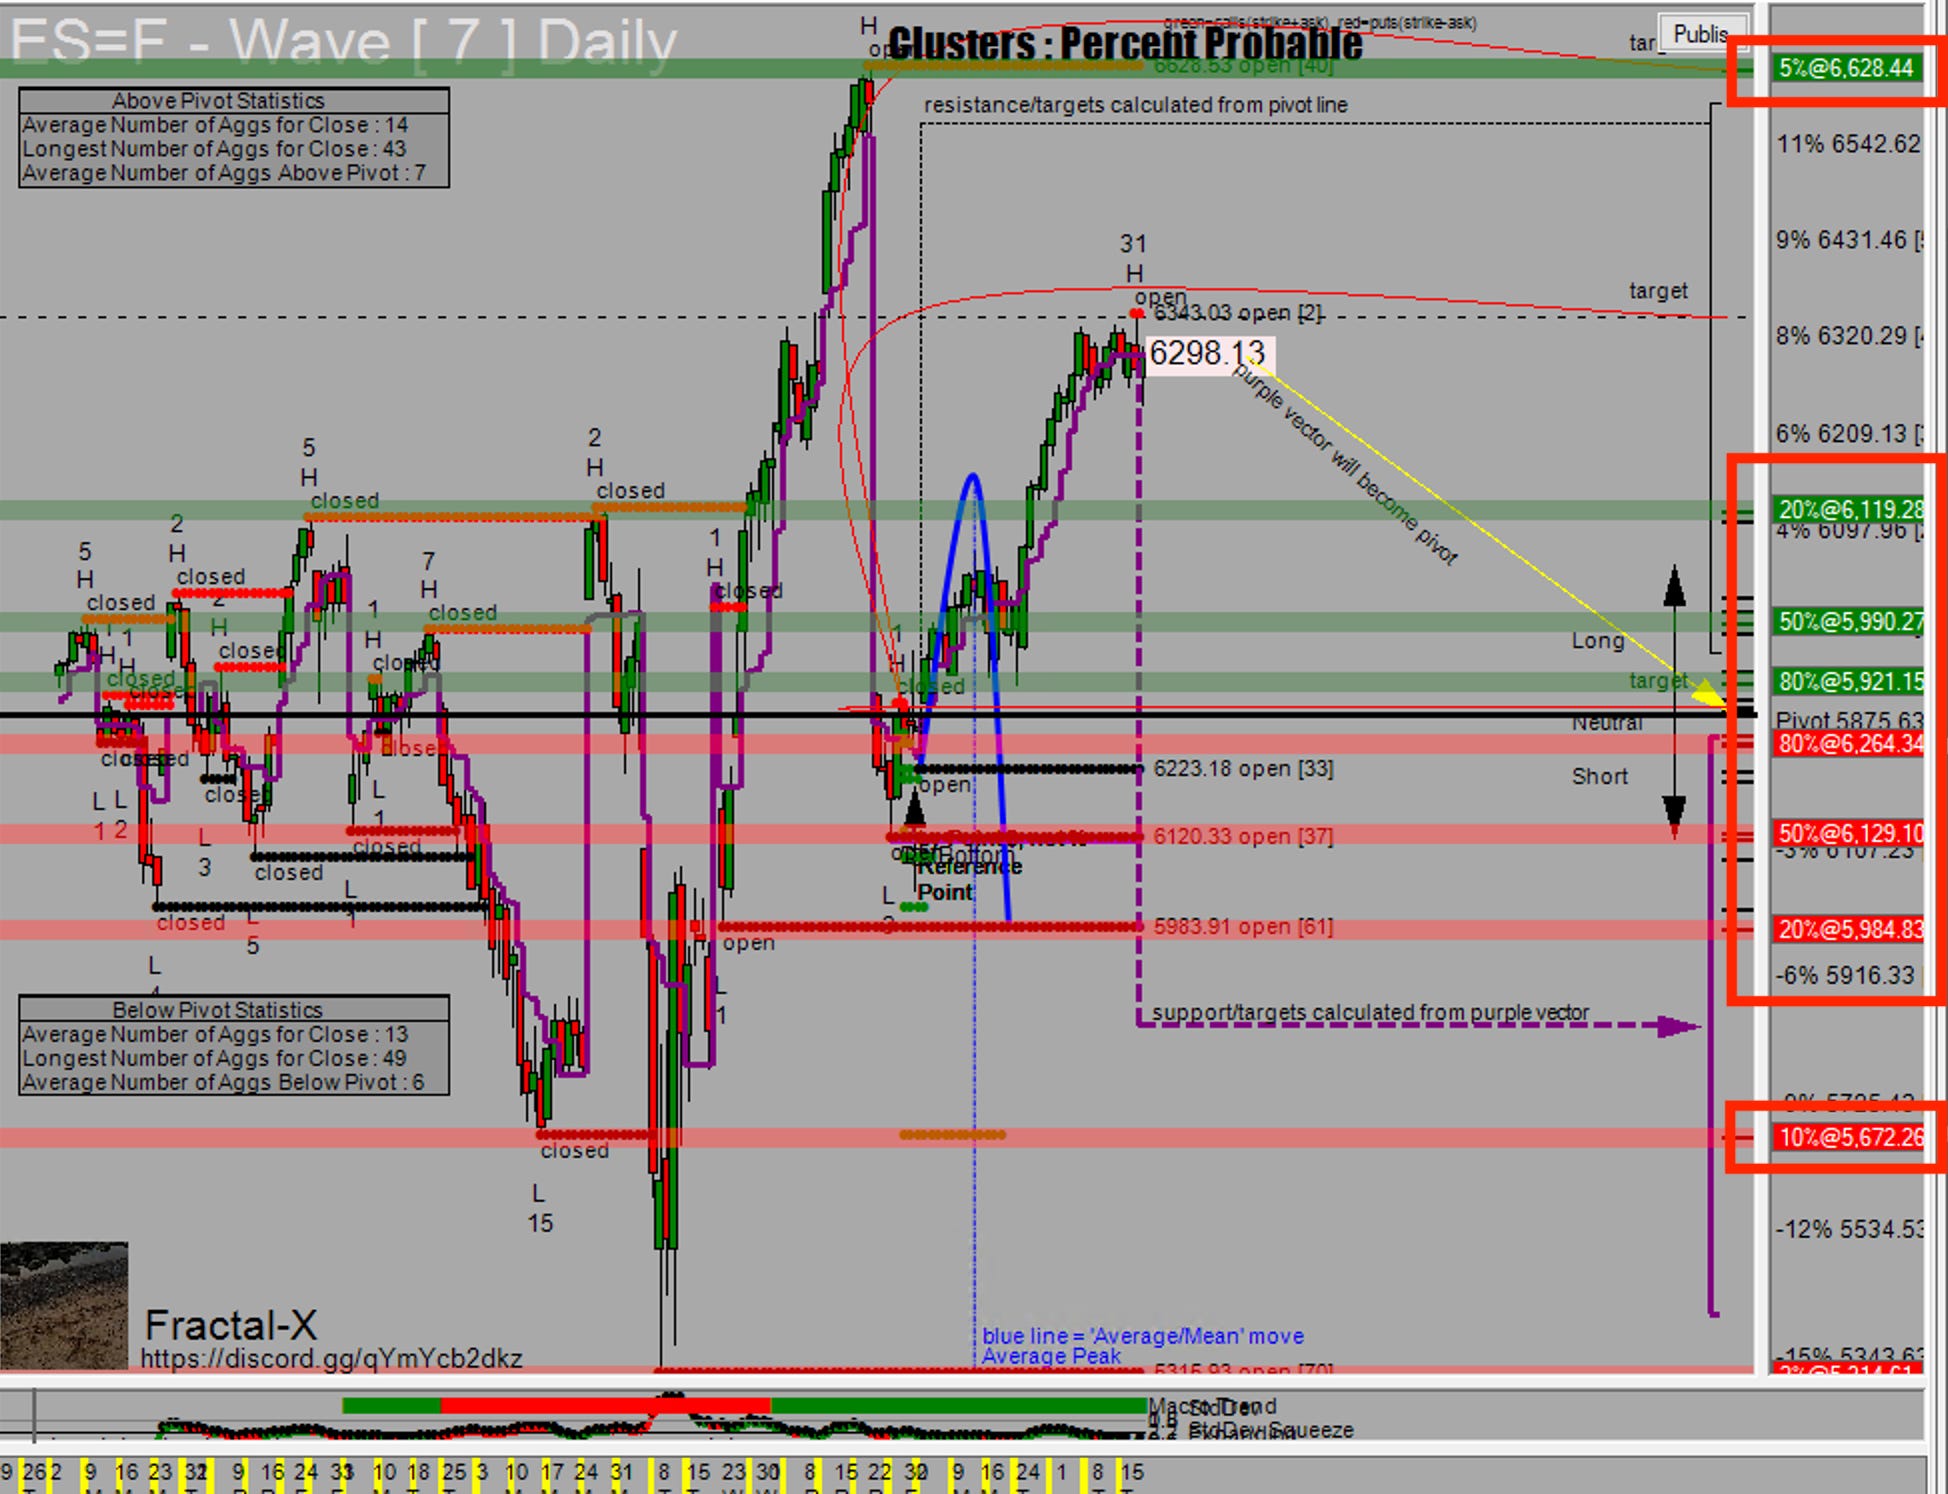
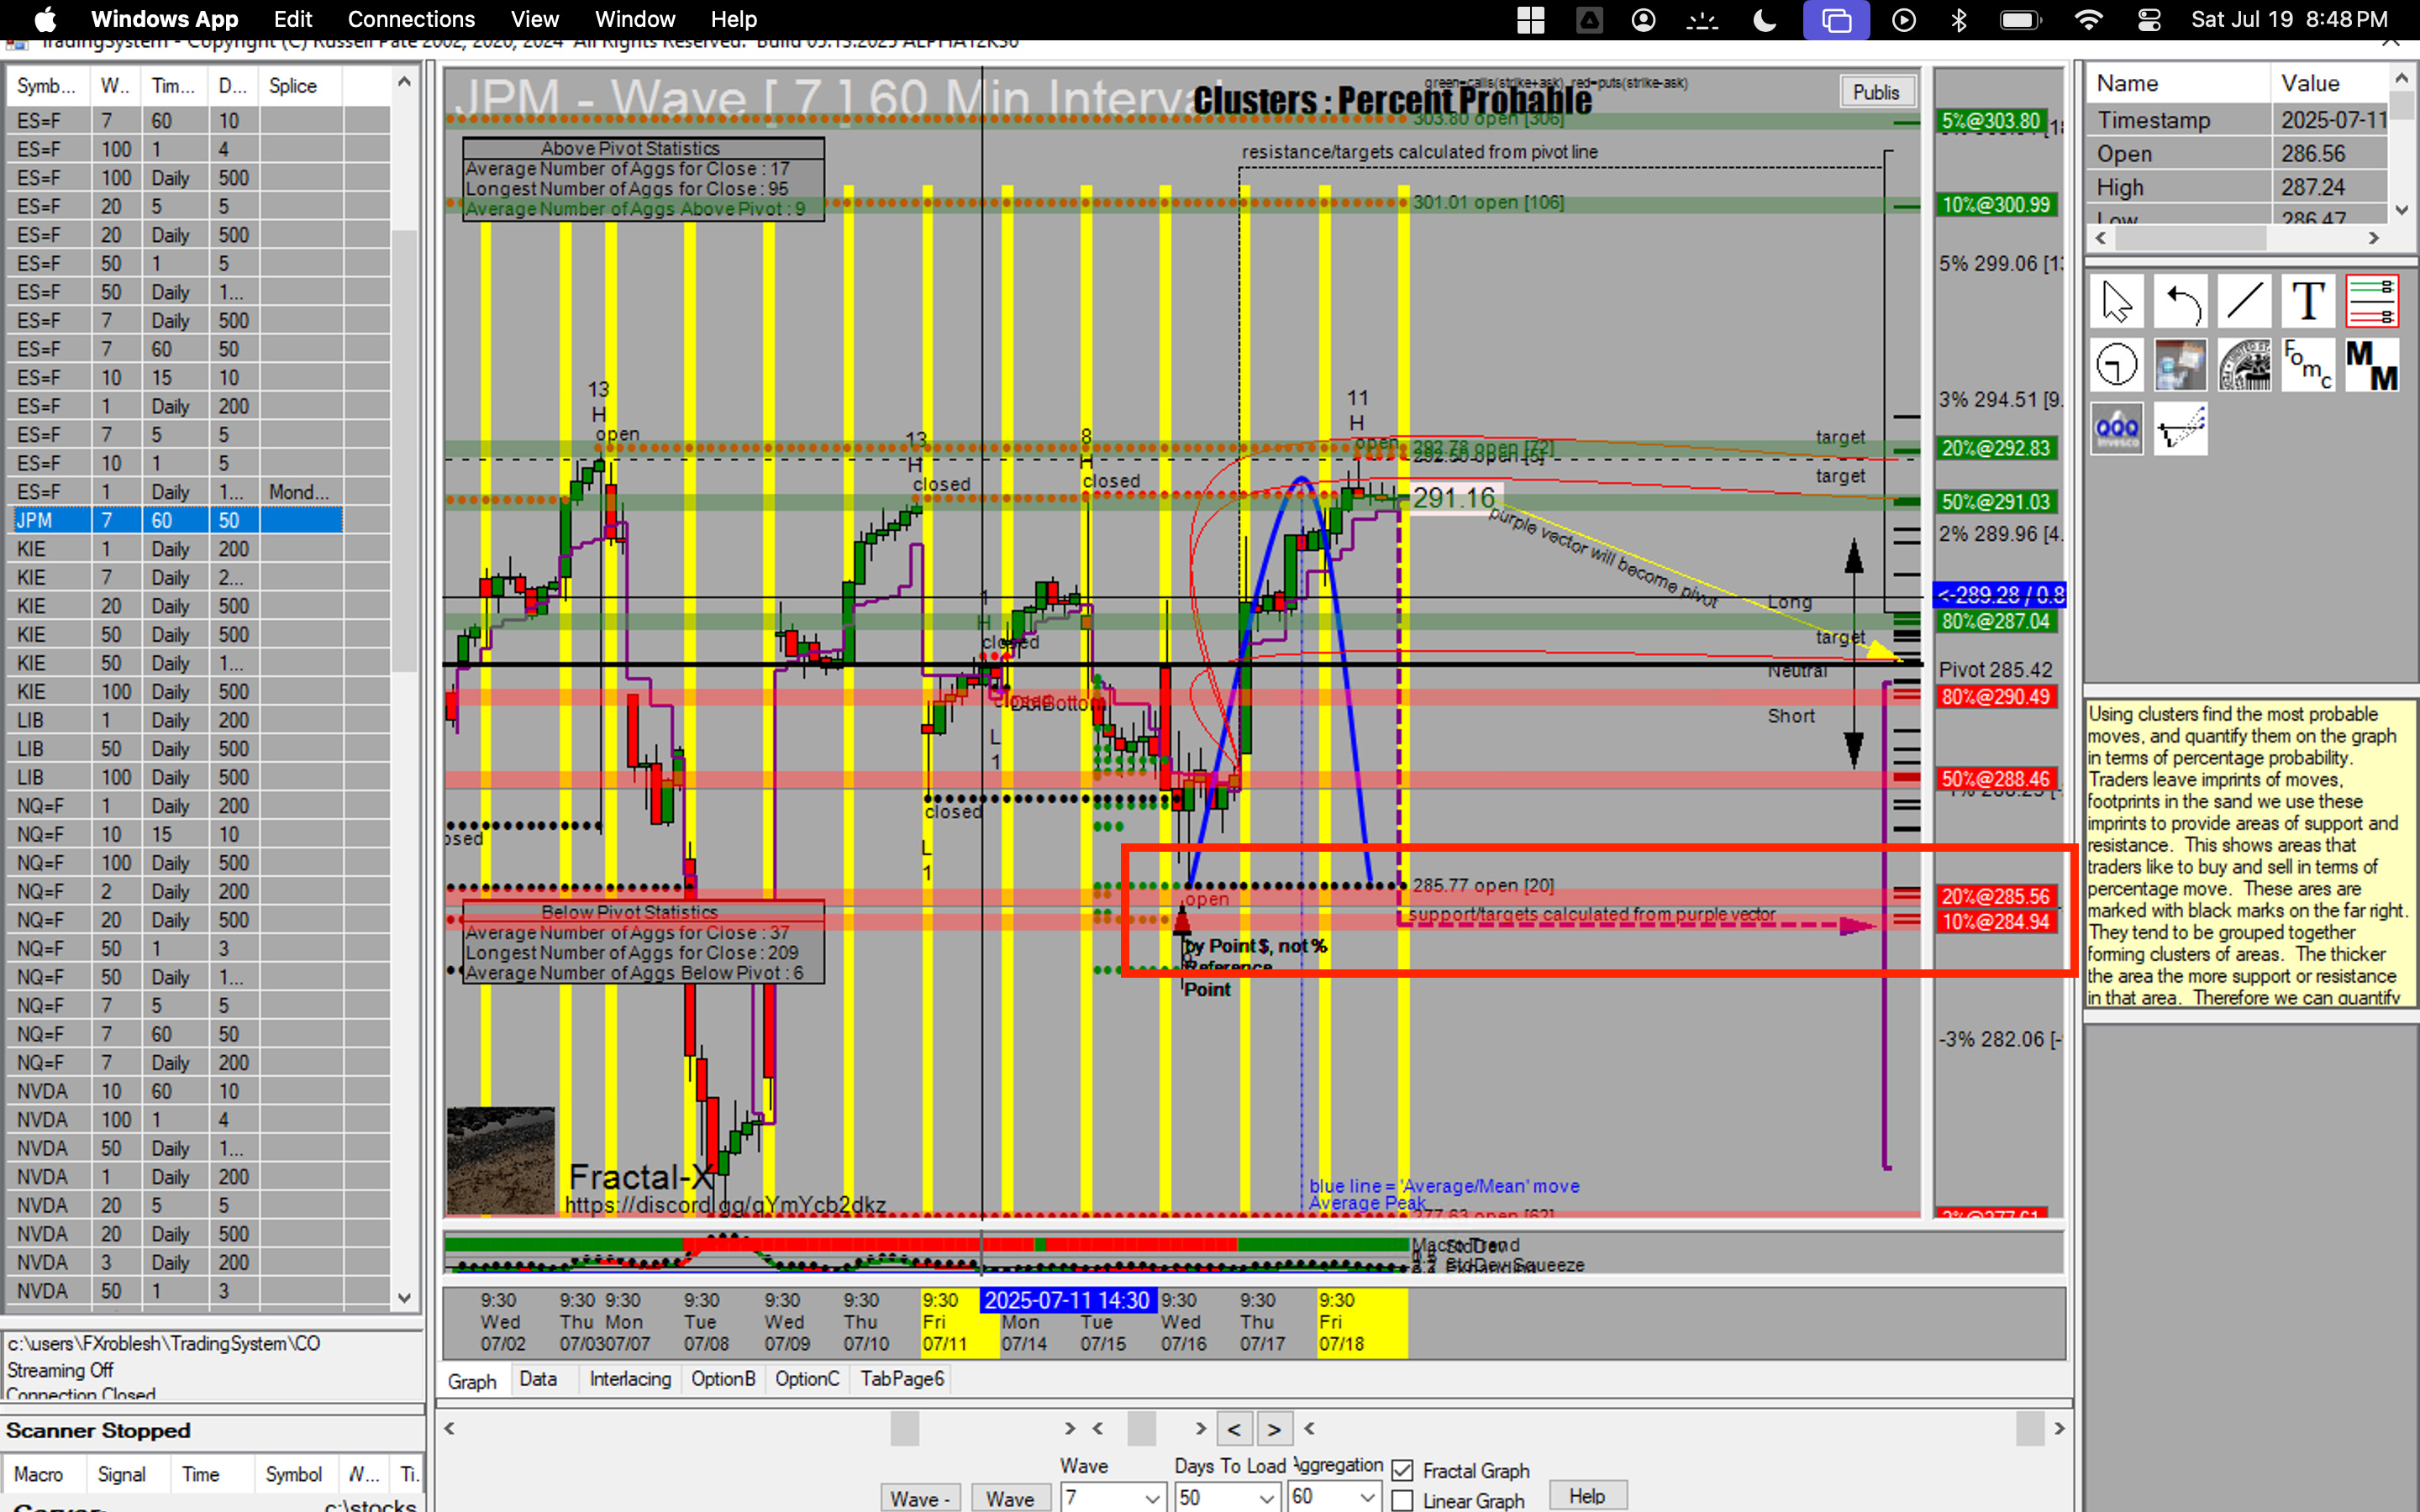
When activated in Graph Settings, Probability Bands overlay horizontal markers at preset confidence levels:
80 % Band – Price reaches this level in roughly 8 out of every 10 cycles after crossing the pivot.
50 % Band – A coin-flip target; half of all cycles tag it.
20 % Band – Only 1 in 5 cycles extend this far.
10 % Band – Rare but tradable in momentum bursts.
2 and 5 % Band – Extreme extension; think climactic move.
Optional: Power users sometimes code 1 % bands for statistical outliers.
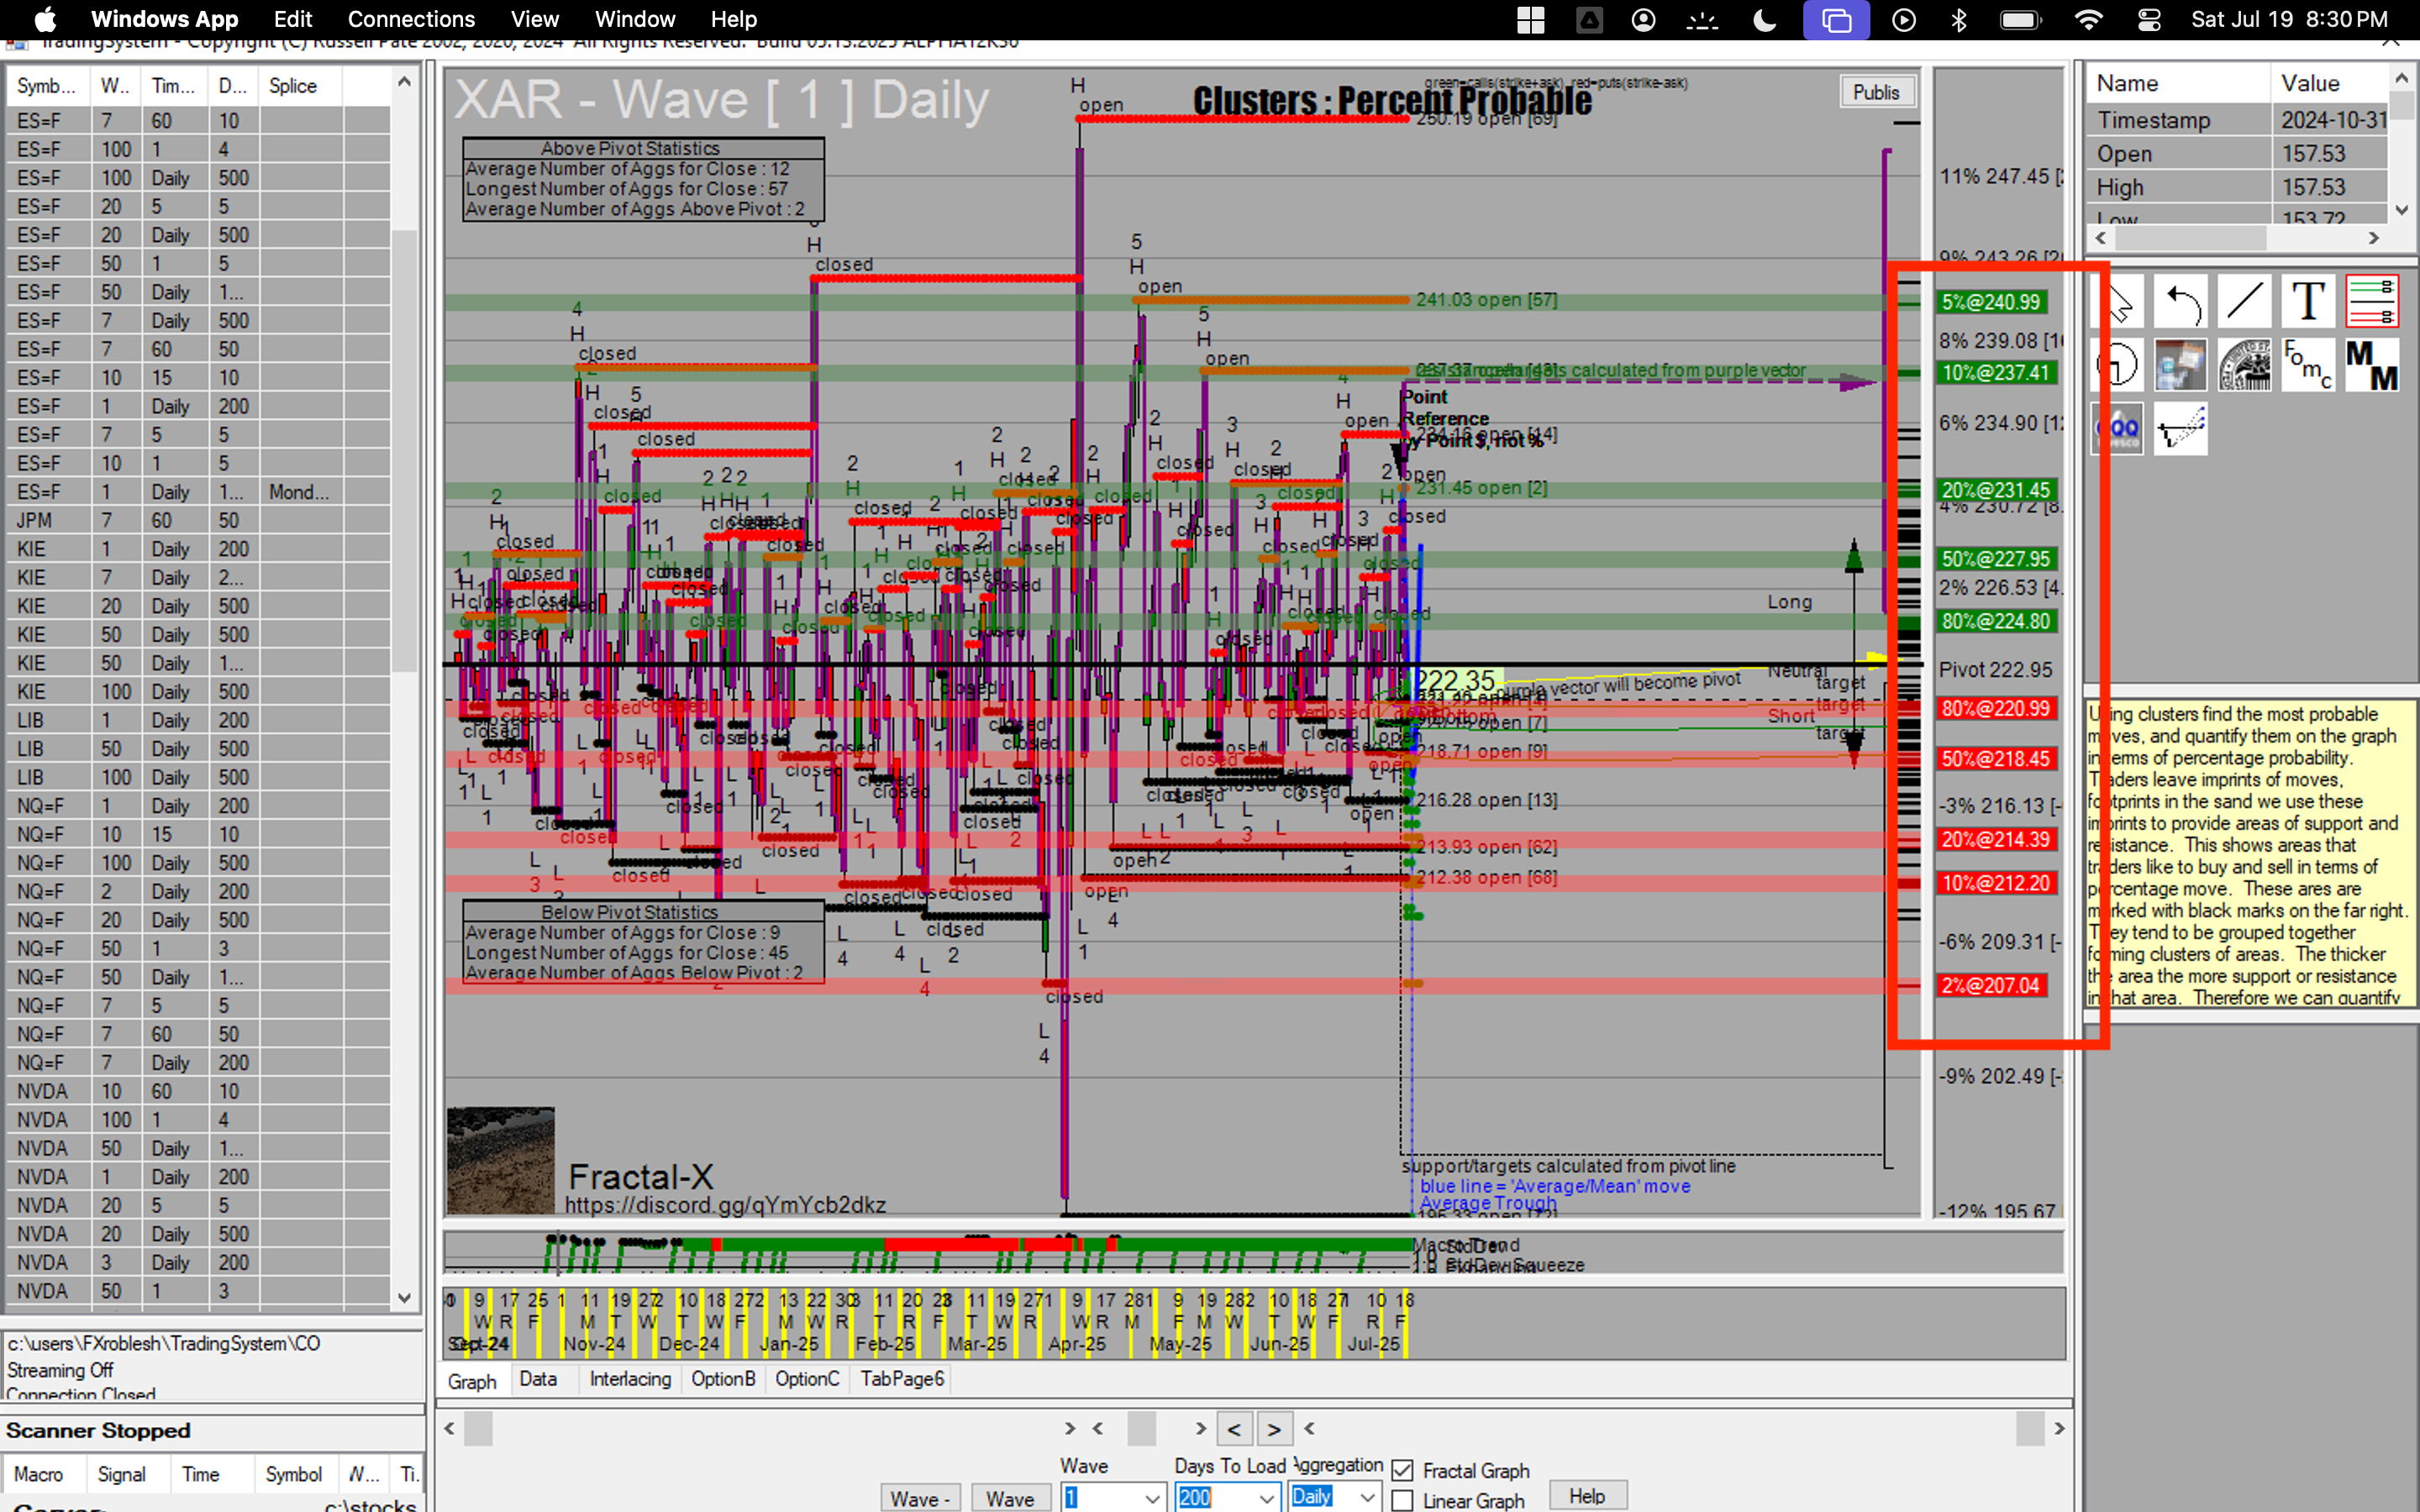
Notice how the bands’ price values will change according to wave length - helps us to understand the relationship of probabilities to wave length and therefore manage our expectations appropriately for the timeframe we are trading.
Using Probability Bands in Real Time
Trend Gauge
Price powering through the 80 % band without pause signals more unusual strength—watch for HL counts to continue climbing.Reversion Alert
If price stalls at the 80 % or 20 % band while multiple open states are closing, a reversion could be igniting.Target Setting
For managing your risks and selecting exits, you could start to trail your stop at the 50% band. For aggressive plays, leave runners toward the 20 % or 10 % band and beyond.
In the picture above, we can see how the 50% probability band is catching the developing reversion.
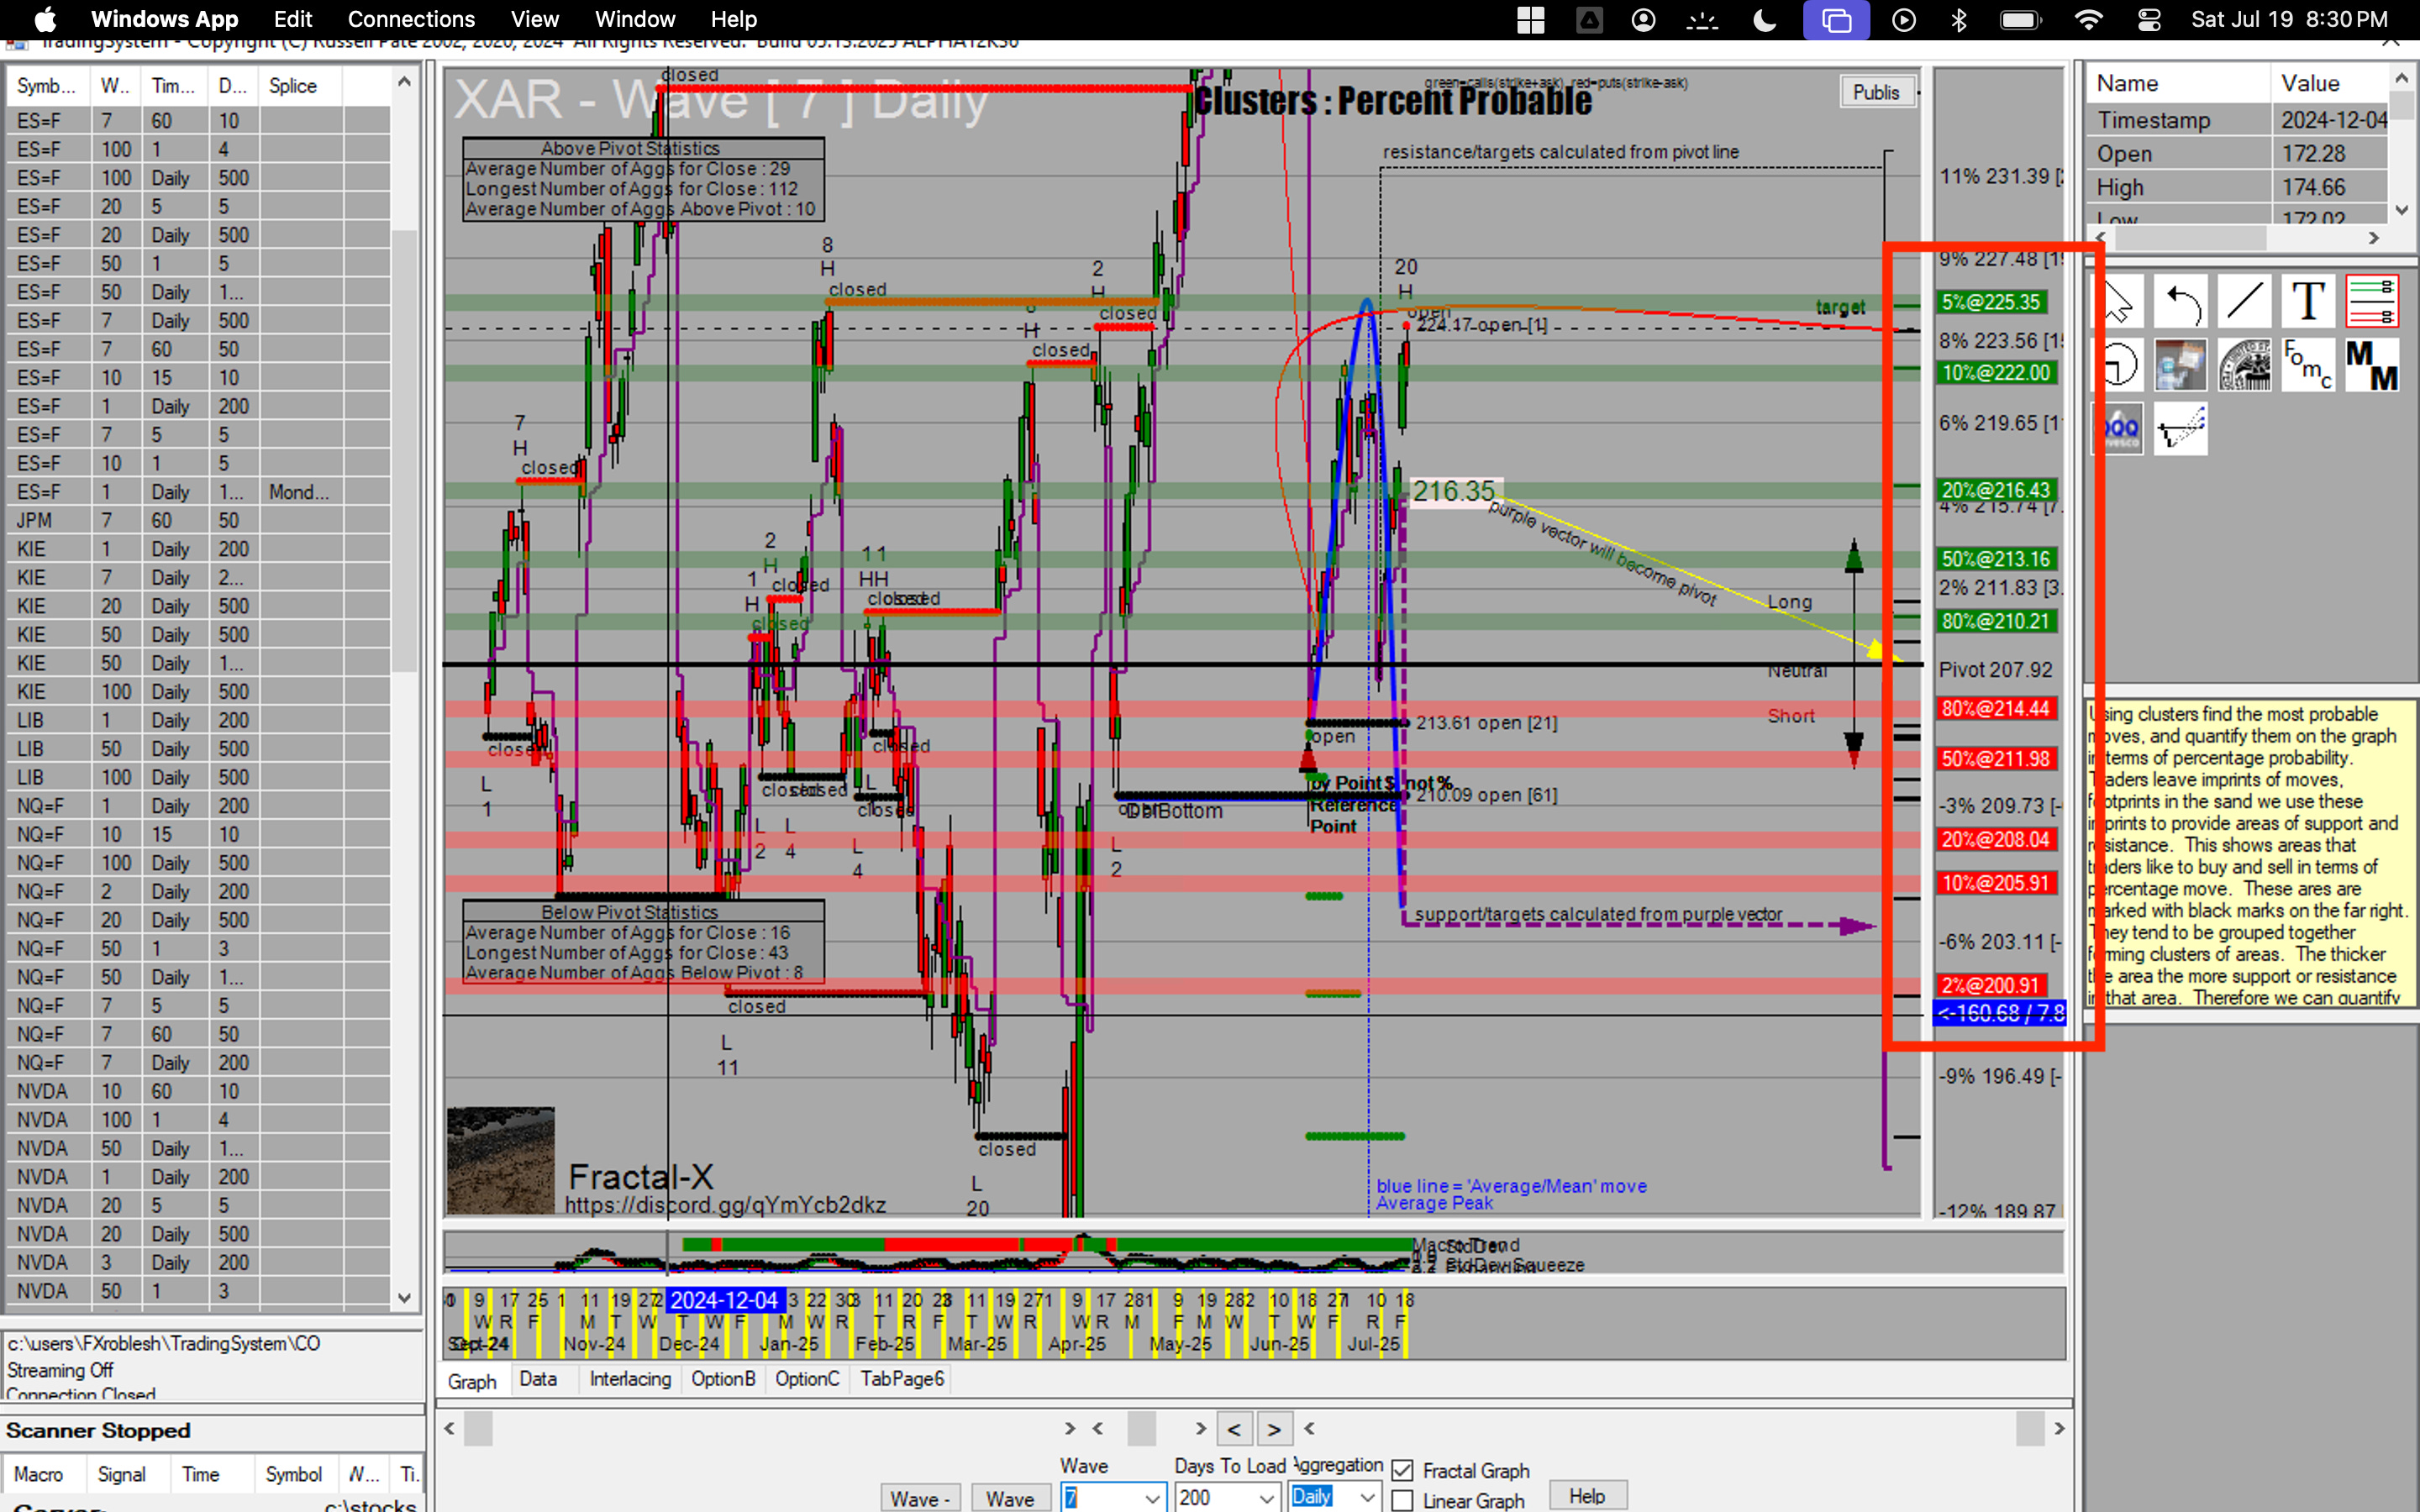
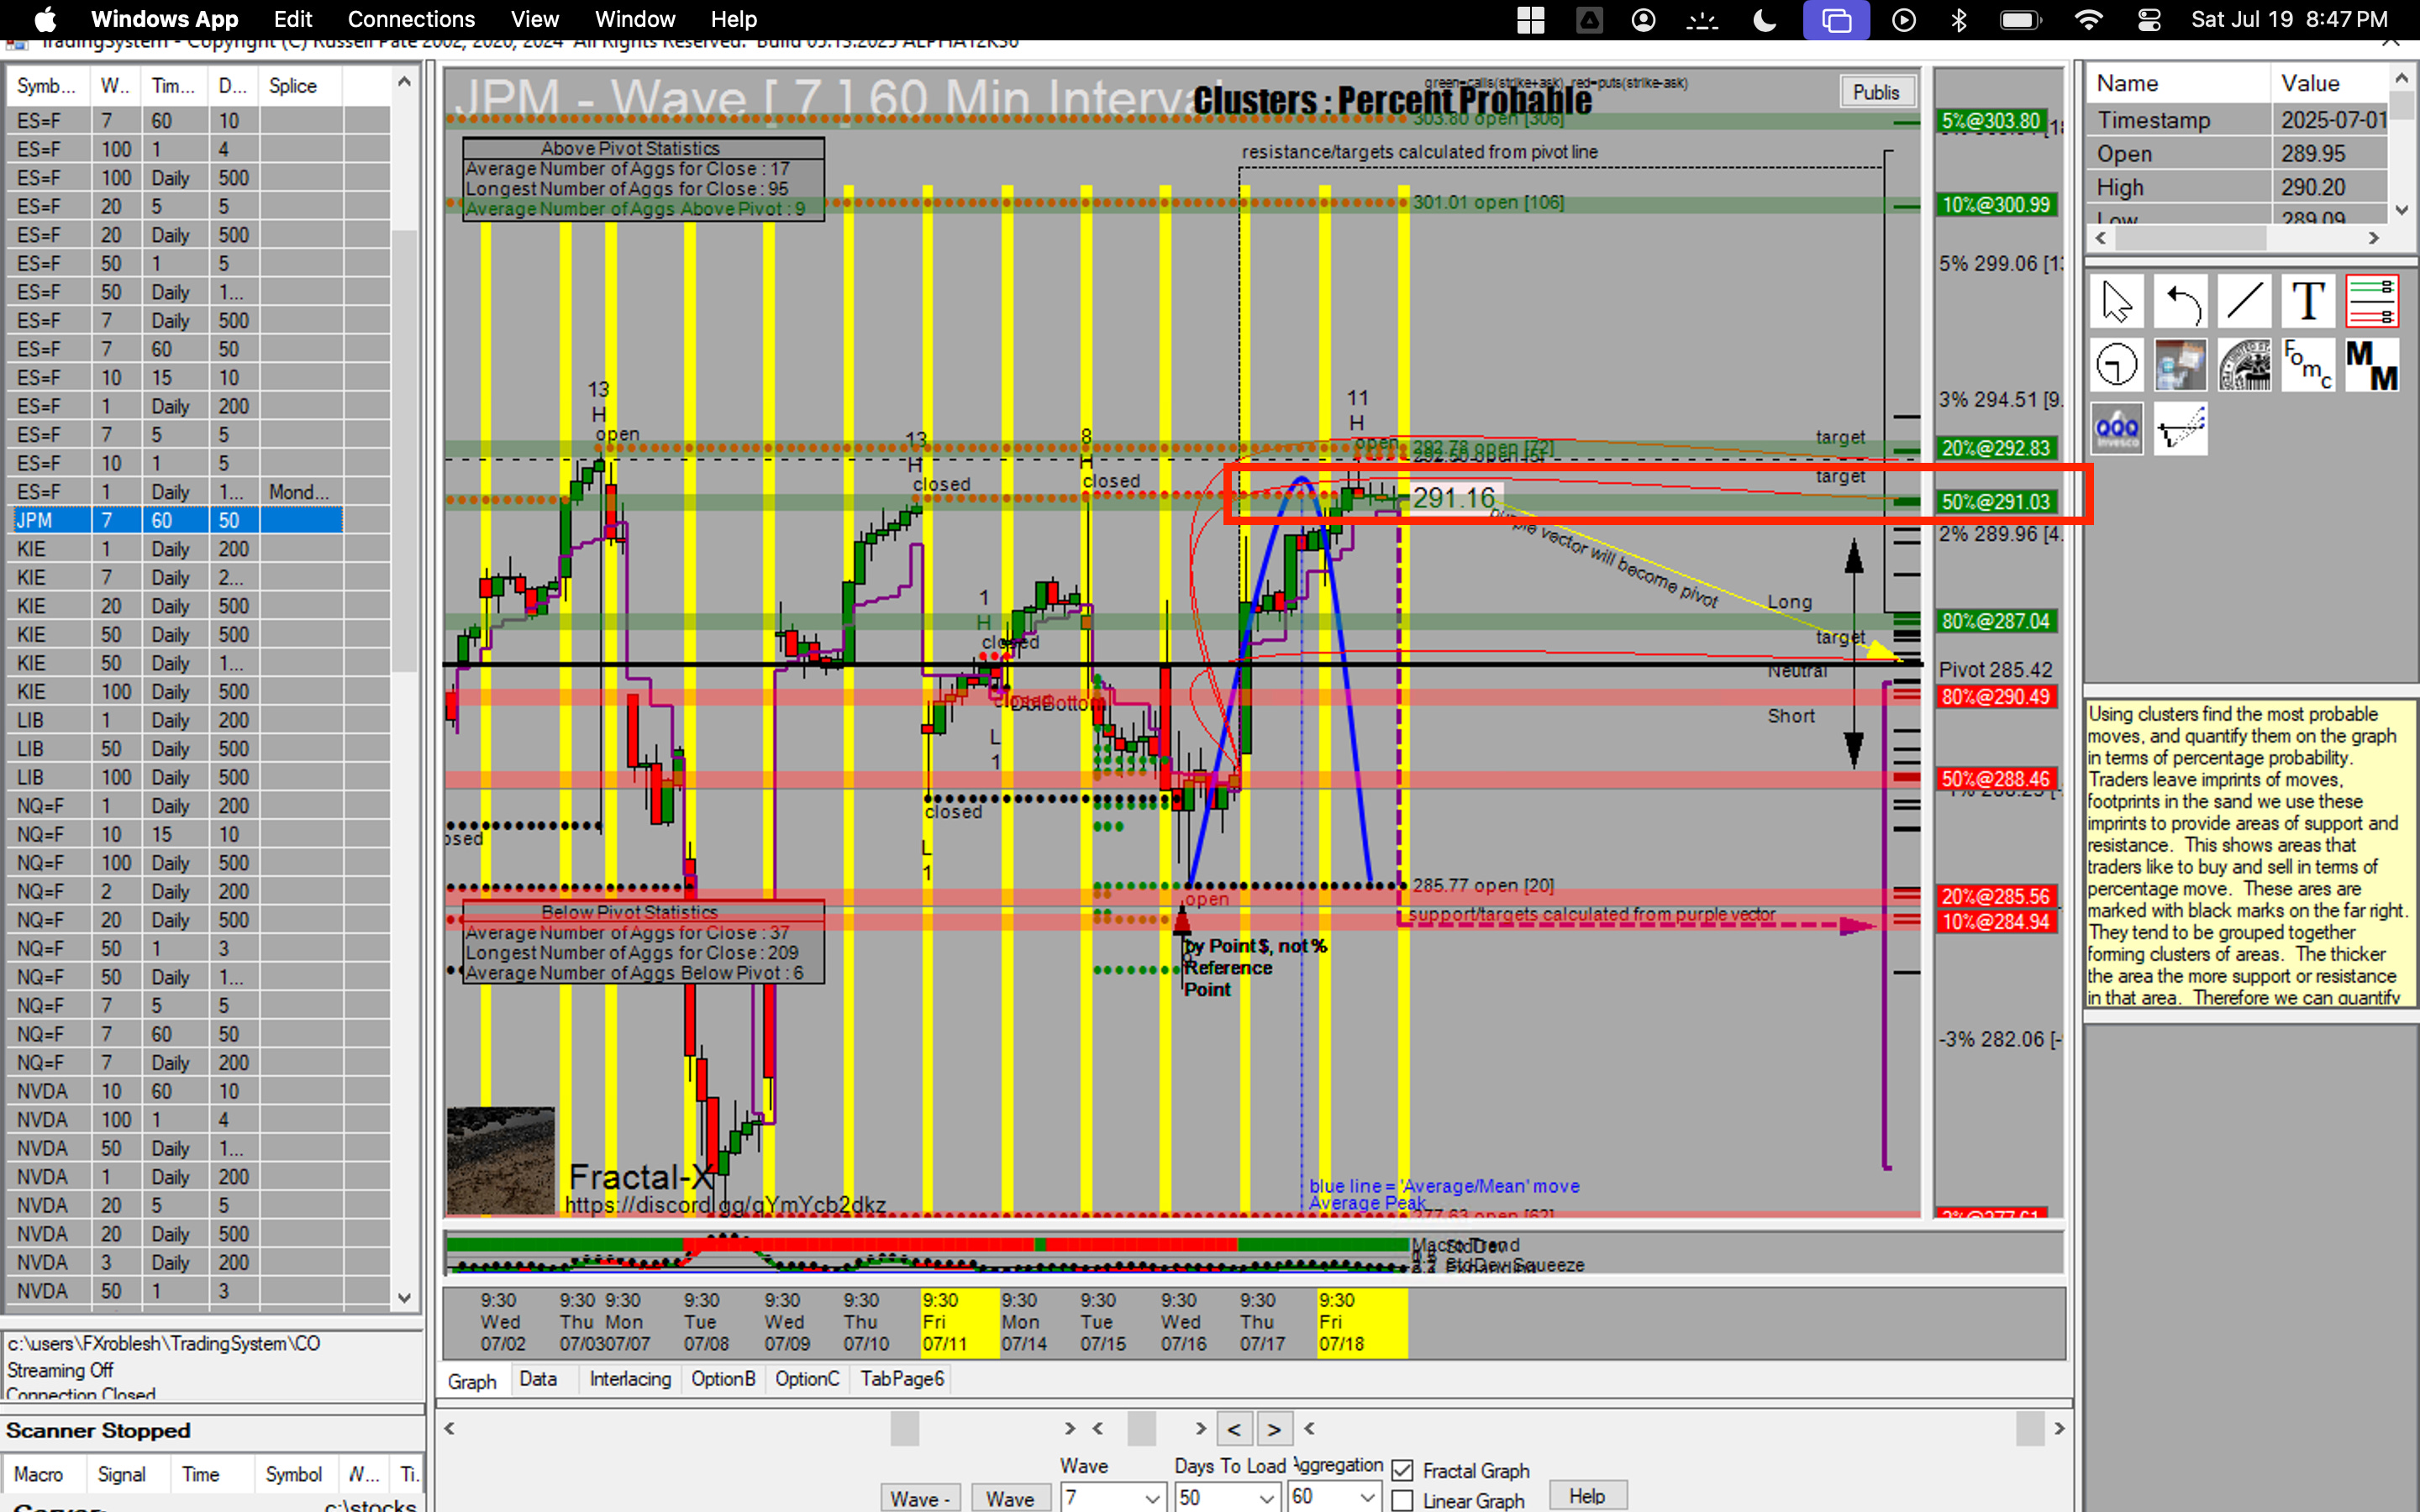
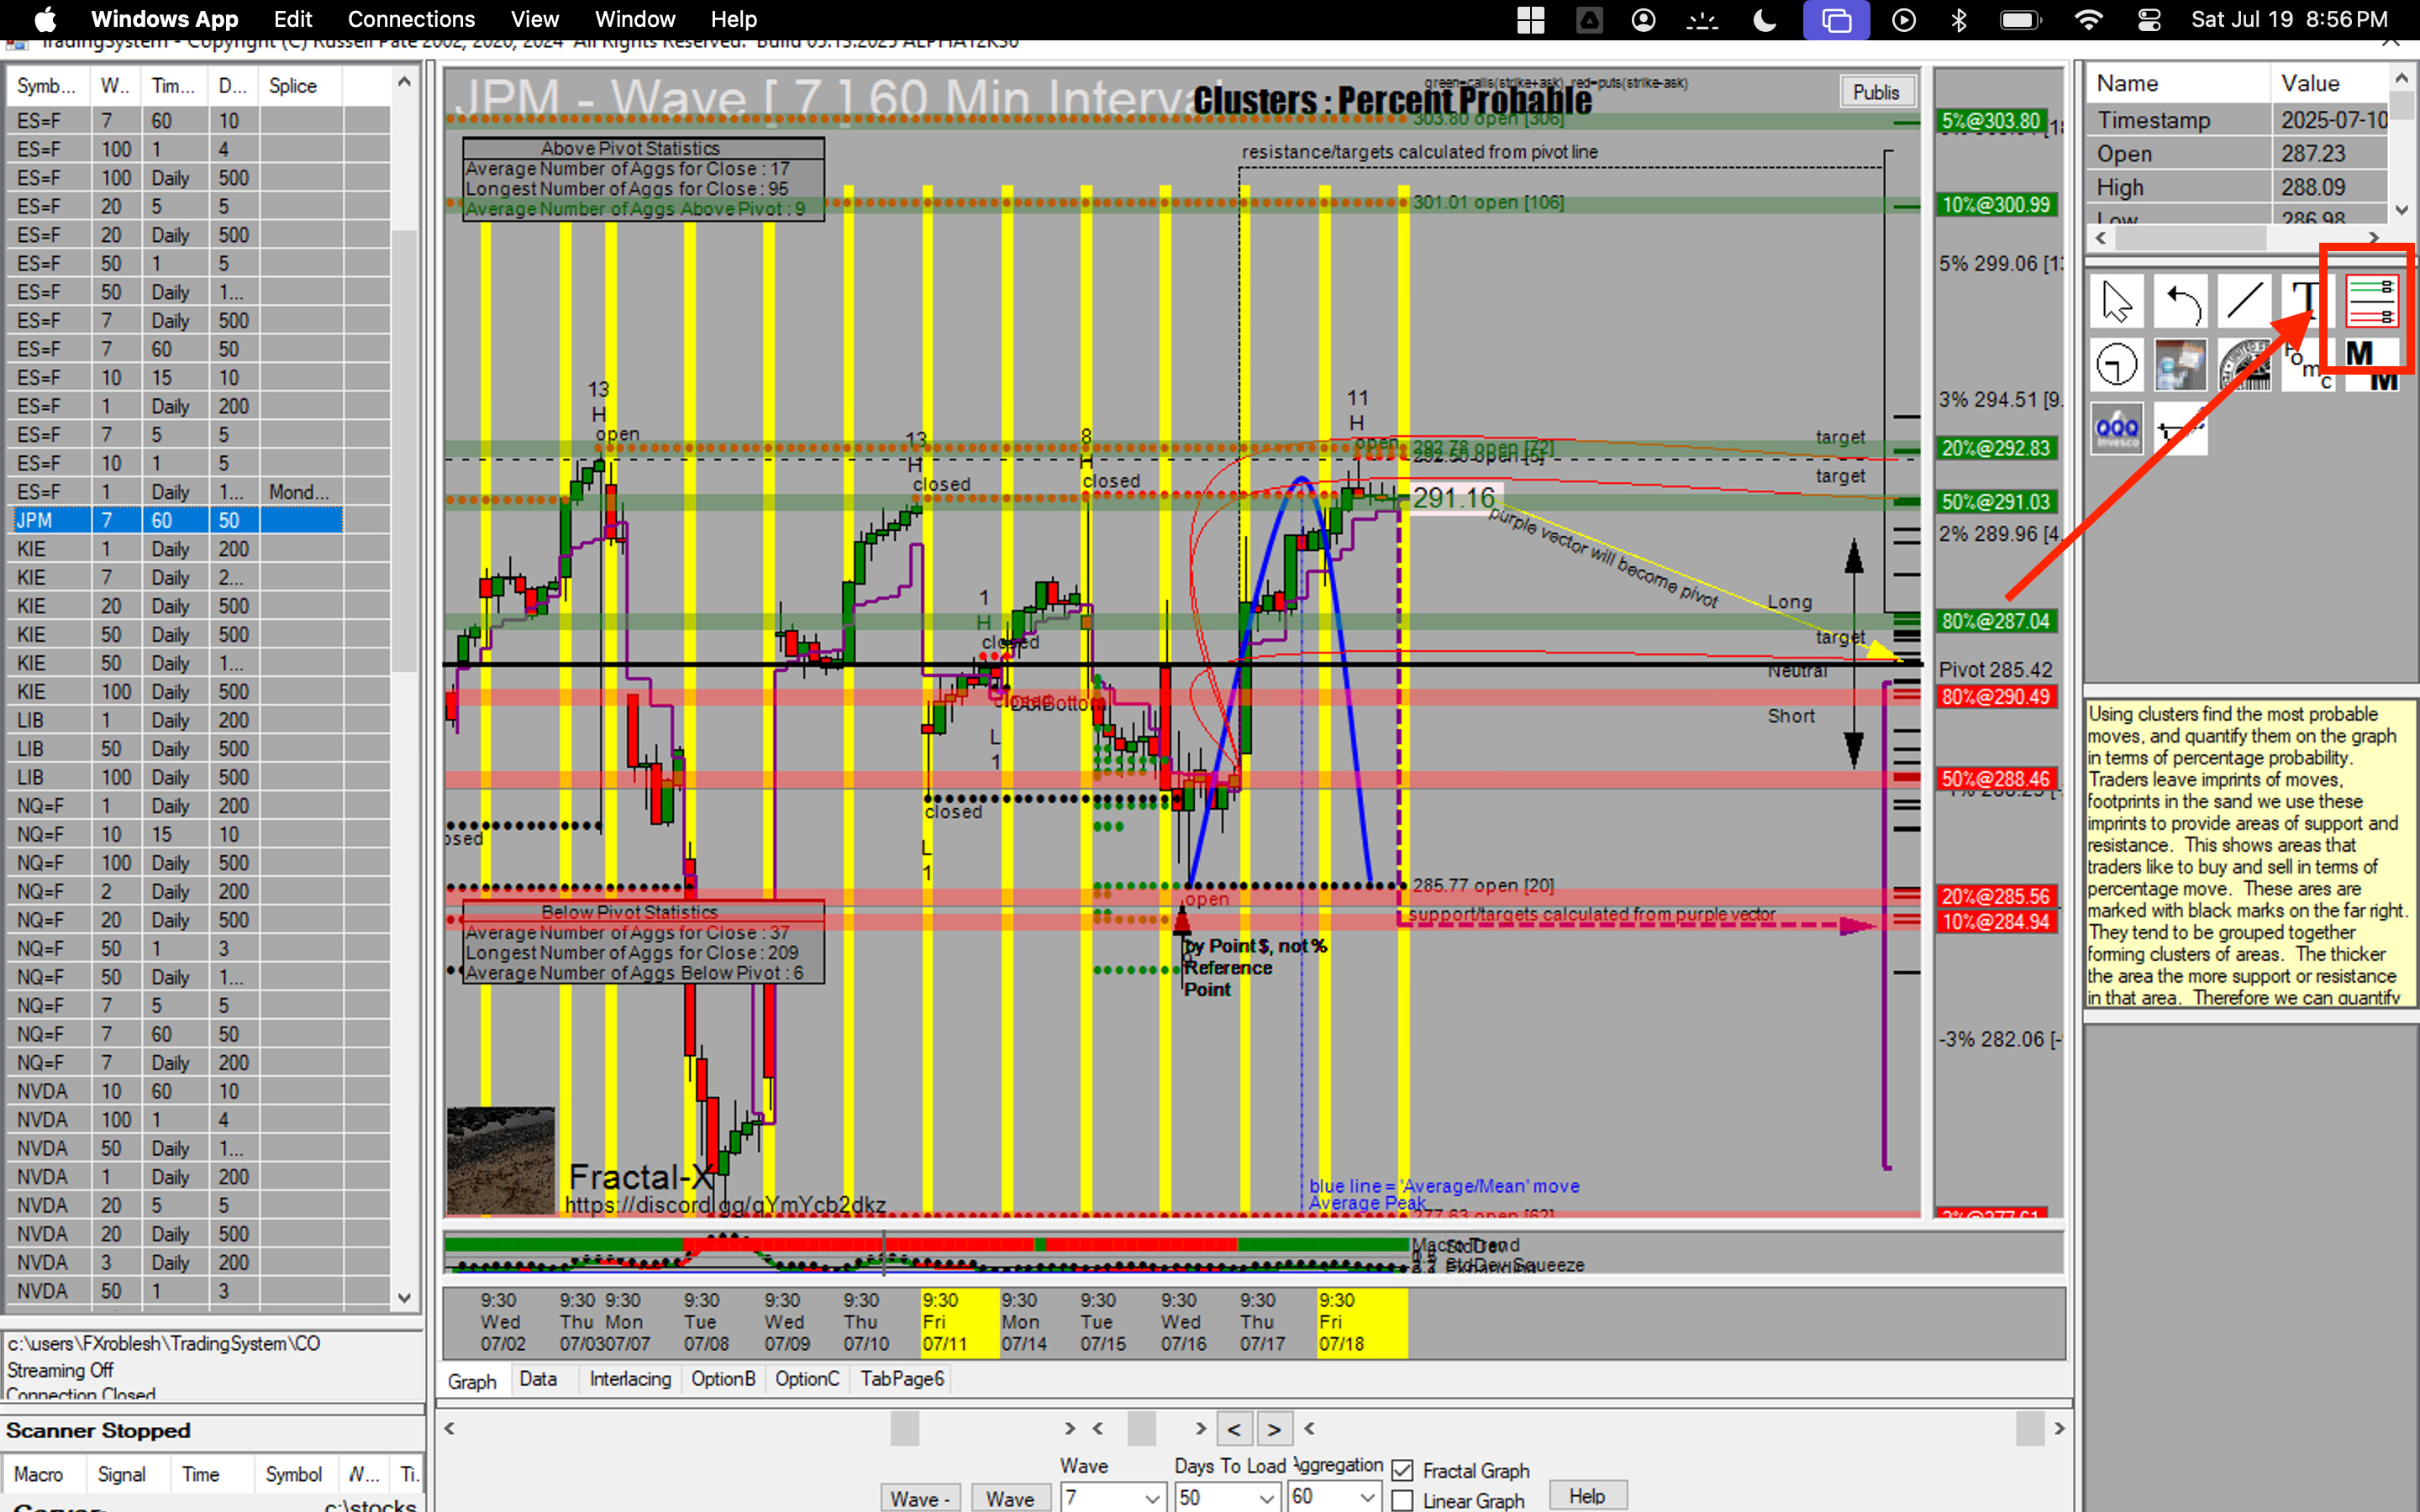
Now look at the picture below, you will see not one, but two probability bands close to each other that sniped the bottom of the last short cycle on JPM 0.00%↑.
Keep an eye out for these. It adds confluence to a reversion.
Band + OA Synergy Scenarios
OA bullish bias + price above 80 % → Take partials; probability of further highs up to the 50% band drop a lot, so take money from the market when it gives it you.
OA bearish bias + price hovering at 10 % band above pivot + price stalling → A reversion play could be building, taking starter positions into a short could be suitable in the event price does climb into an outlier.
These scenarios are especially detectable when you have an eye on the option analyzer and the fractal chart with probability bands on (quick look to turn them on below).
Common Misunderstandings
“Band hit = immediate reversal.” Not always. HL effort and vector slope must confirm exhaustion.
“Bands predict direction.” They only measure extension probability after the pivot cross.
“Lower bands are noise.” Five-percent bands often mark capitulation lows—great spots for risk-defined fades.
You might think that 1% bands are not necessary, but they are very helpful to measure super high probability reversion zones (99%), but they also can serve as targets upon volatility-inducing events like economic news releases, earnings, and geopolitical news when a trend may be in “continuation” mode.
Action Checklist
Turn on Probability Bands in settings.
Note current vector/pivot value and band distances.
Log each band touch with OA biases.
Build a playbook: 80 % tag + OA continuation bias + vector support = possible reentry.
Coming Up
Part 7 will walk through the average mean wave, a super helpful tool to also visualize the average distance price will travel from a reversion point.
Ready to trade with quantifiable odds instead of gut feel? Let the Probability Bands draw the statistical map—then use your Fractal toolkit to navigate it.
Confirmed