
Spread Monster Overview: Visualizing Scenarios for Fractal Traders
Series: Roadmap to Fractal Mastery – Part 10

The Spread Monster is one of the Fractal System’s deepest yet most powerful features, running forward-looking statistics via synthetic trading, machine learning, and more to forecast price behaviors under diverse scenarios.
In this article, we’ll touch on its core capabilities and show how Fractal traders gain probabilistic insight into market moves.
What Is Synthetic Trading?
Synthetic trading simulates thousands of hypothetical trades across varying market conditions, allowing the Spread Monster to generate real-time probability distributions. Top hedge funds—like Two Sigma and DE Shaw—use similar Monte Carlo and machine-learning frameworks to manage risk and optimize execution according to different scenarios.

Core Spread Monster Capabilities
HL Matching: Measures how often current peaks and troughs mirror historical cycles, taking into account continuation or reversal odds into calculations (and so much more).
Weekday Matching: Analyzes past performance on specific weekdays to adjust strategies for recurring patterns.
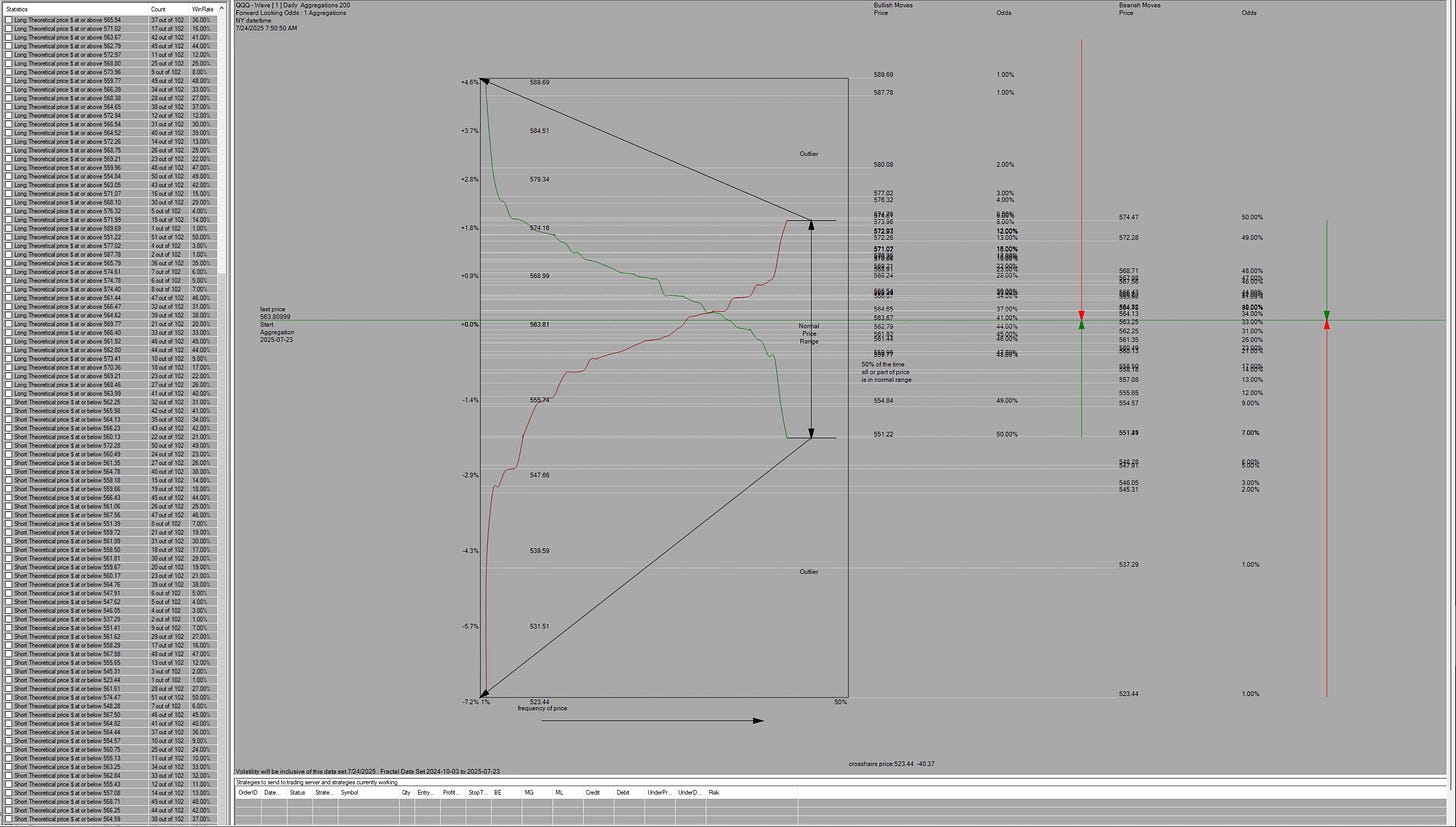
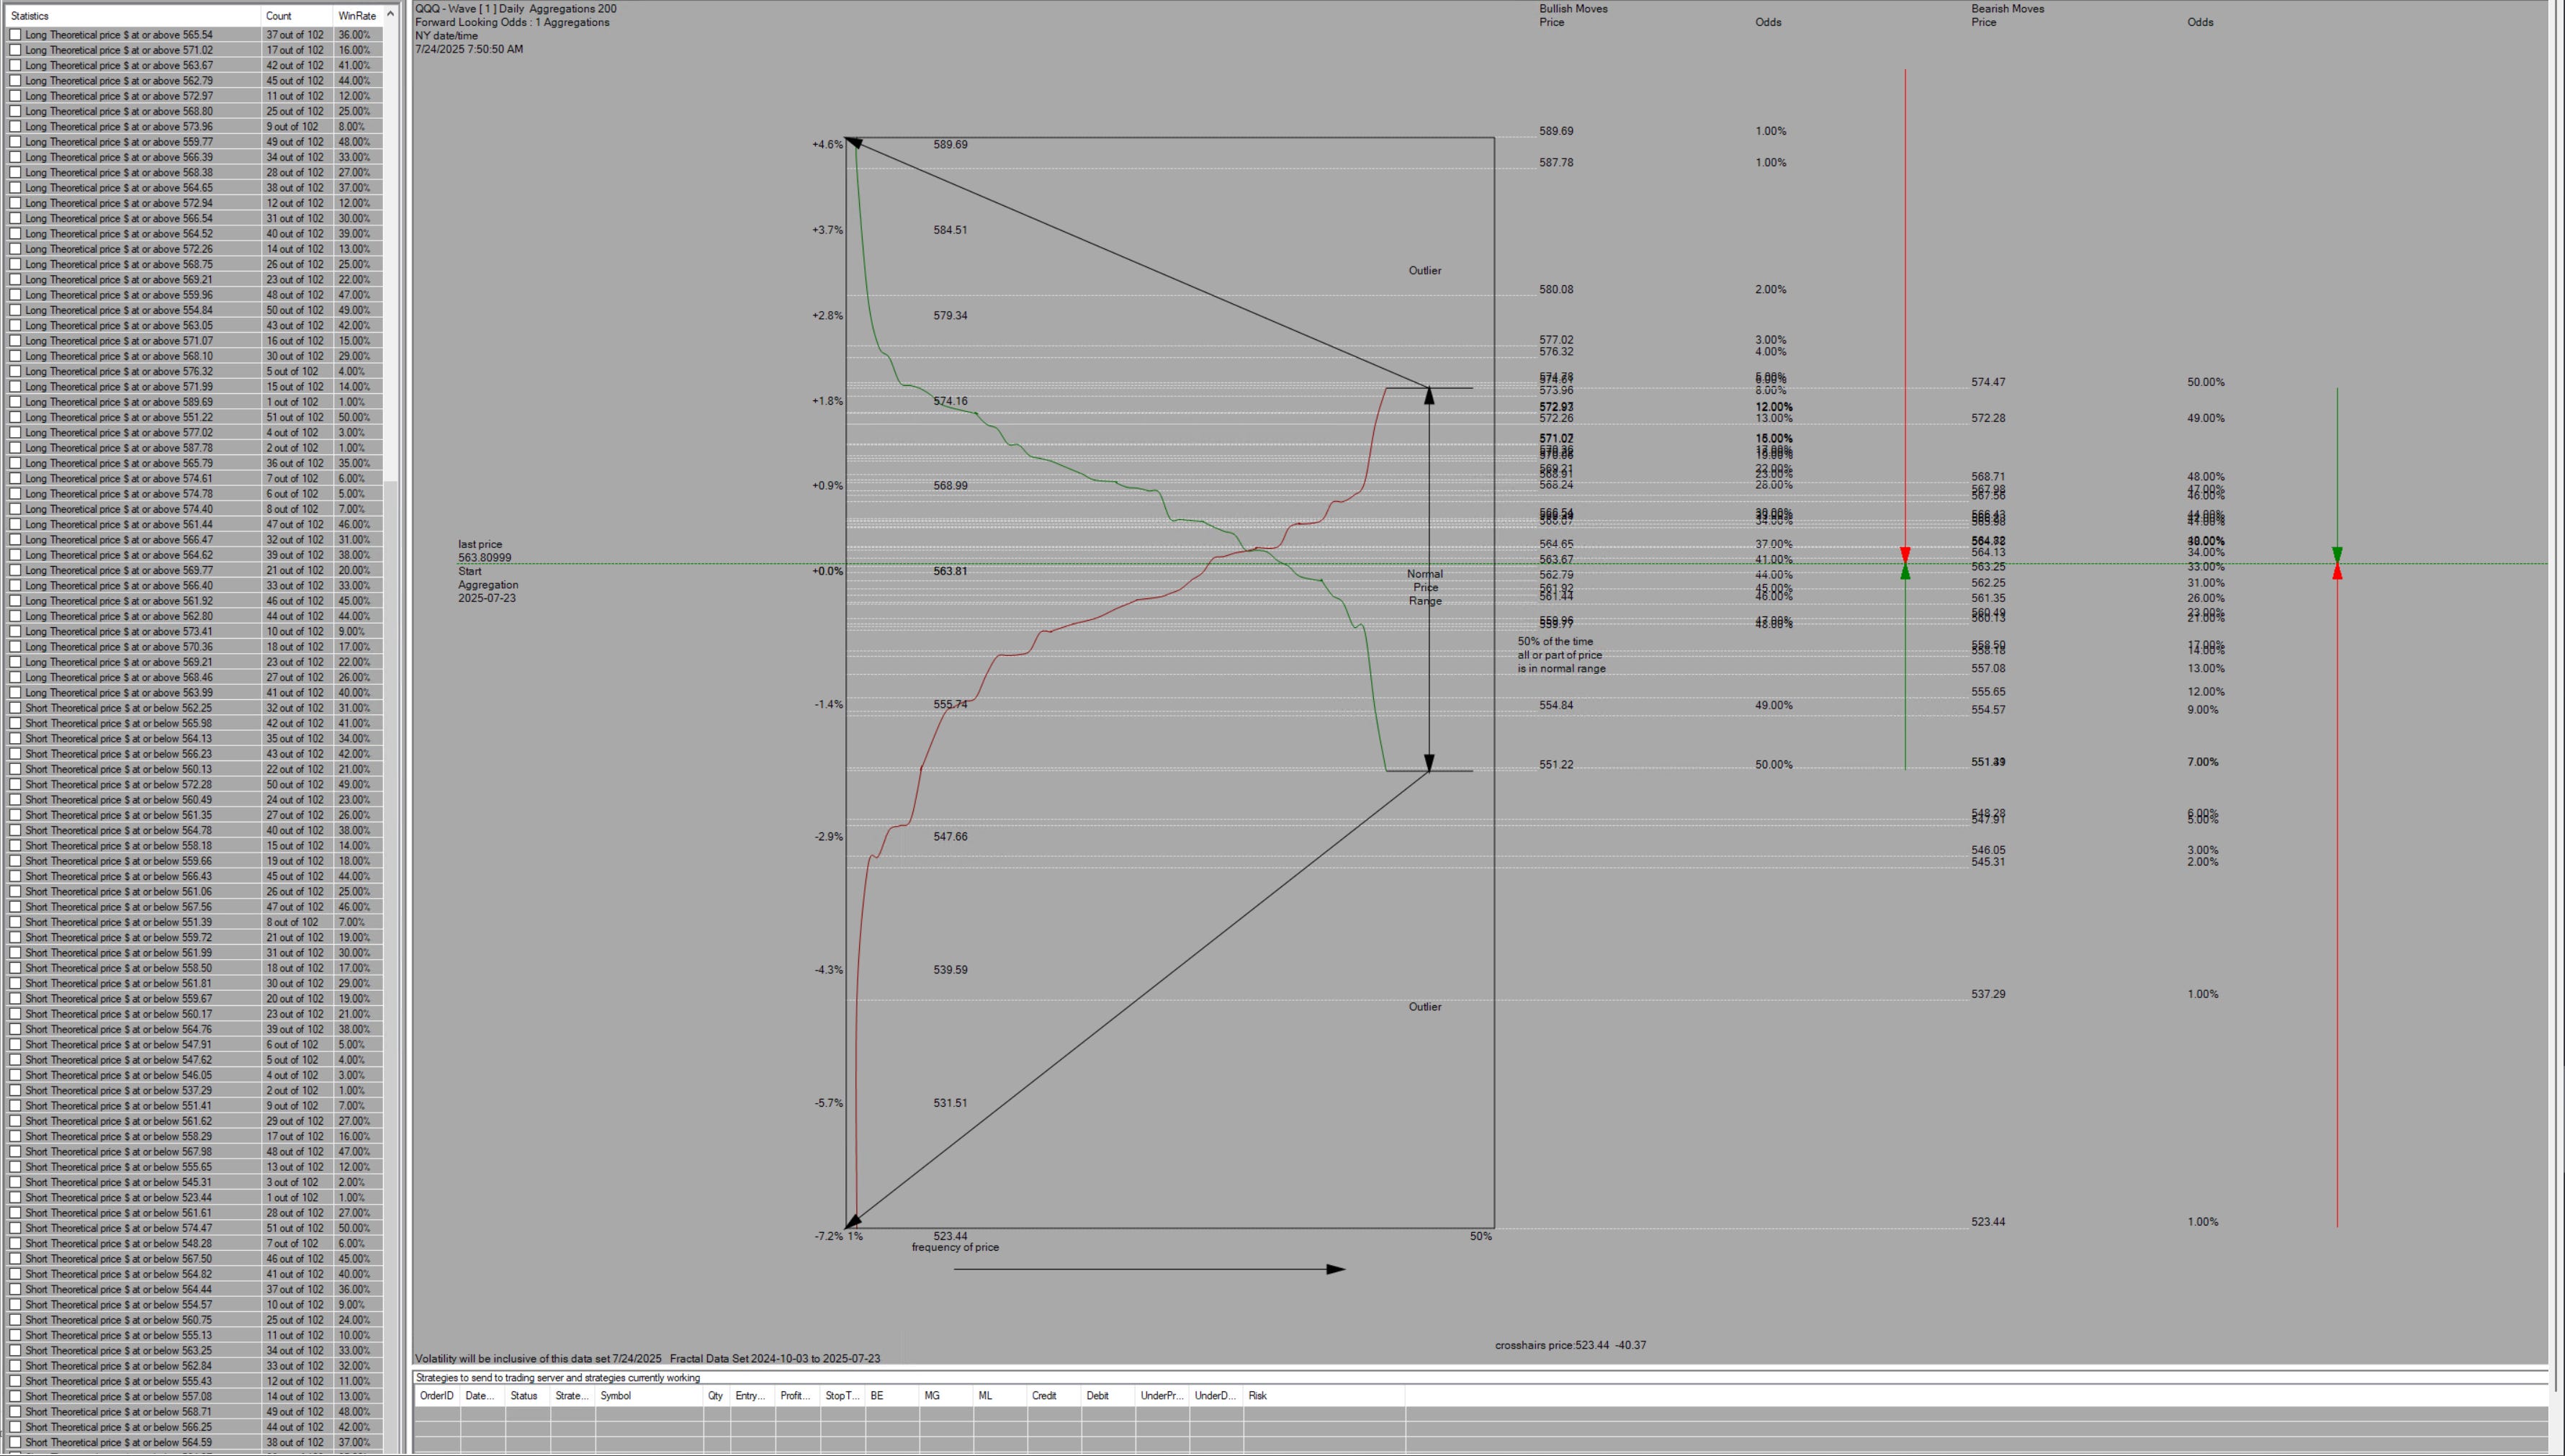
High/Low of Day Probabilities: Displays the odds of price reaching projected day-high or day-low levels.
Volatility Graphs (below): Visualize the ranges for the timeframe selected.
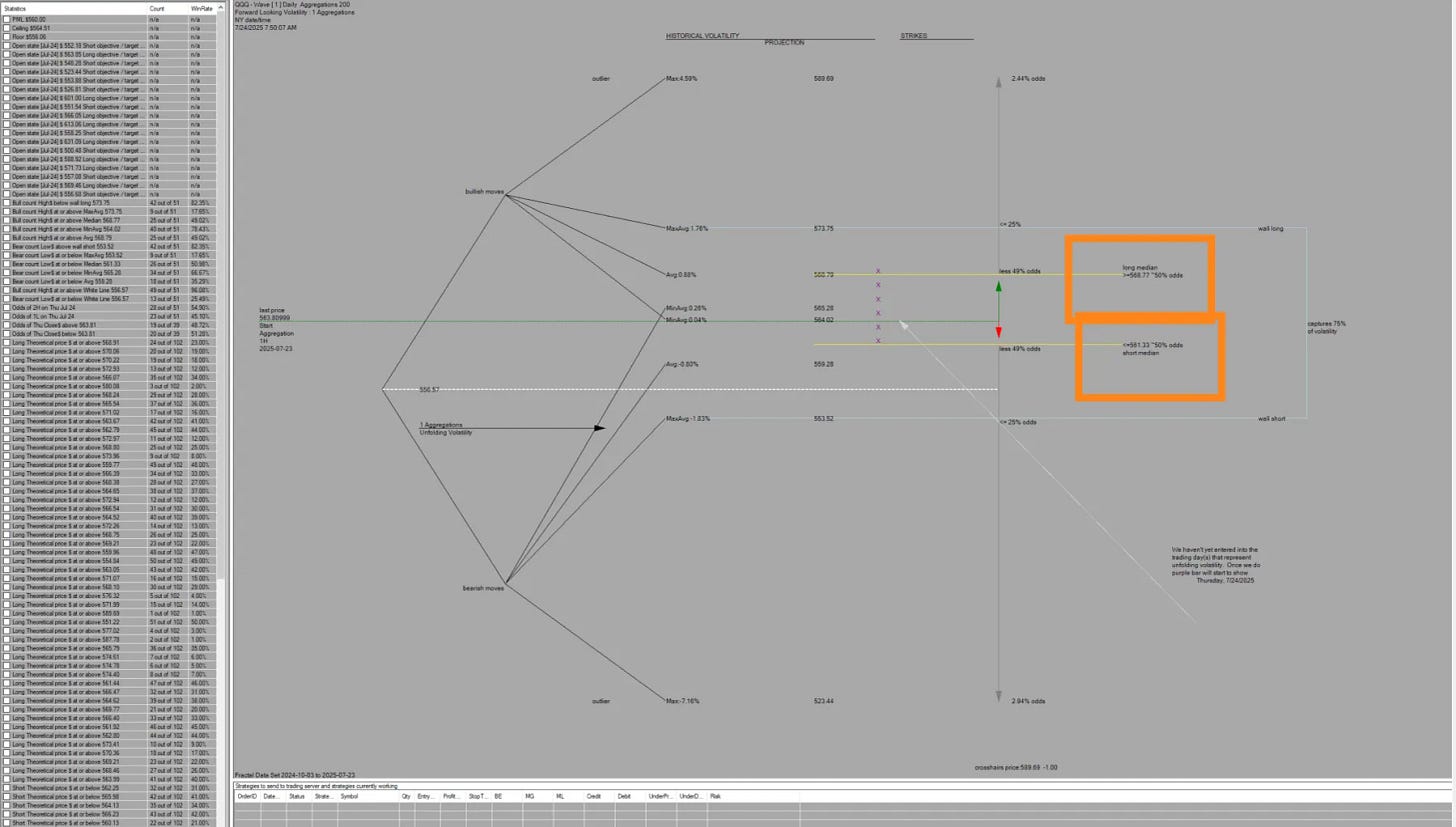
Odds Graphs (below): Visualize the odds for different moves on the timeframe selected.
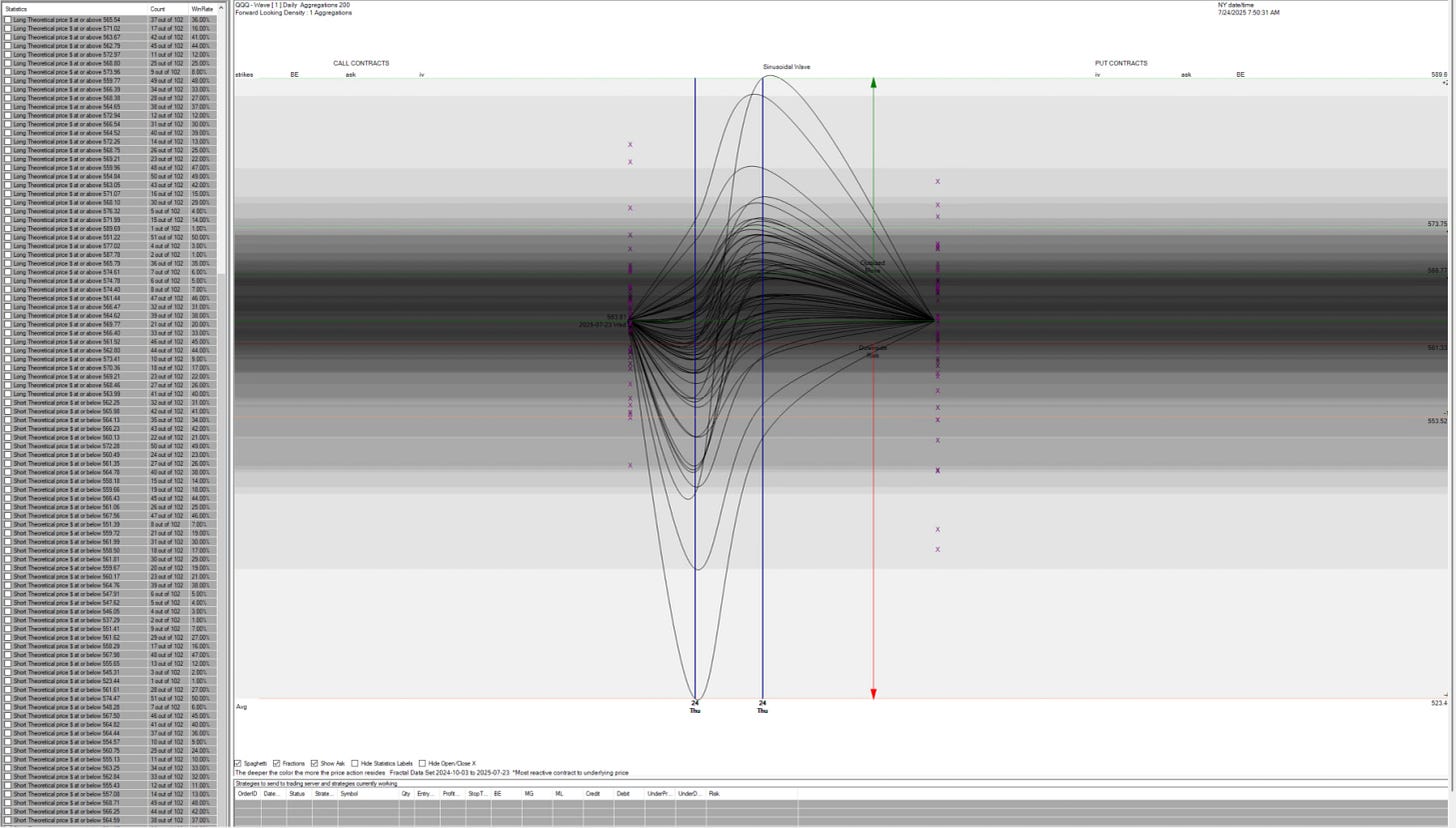
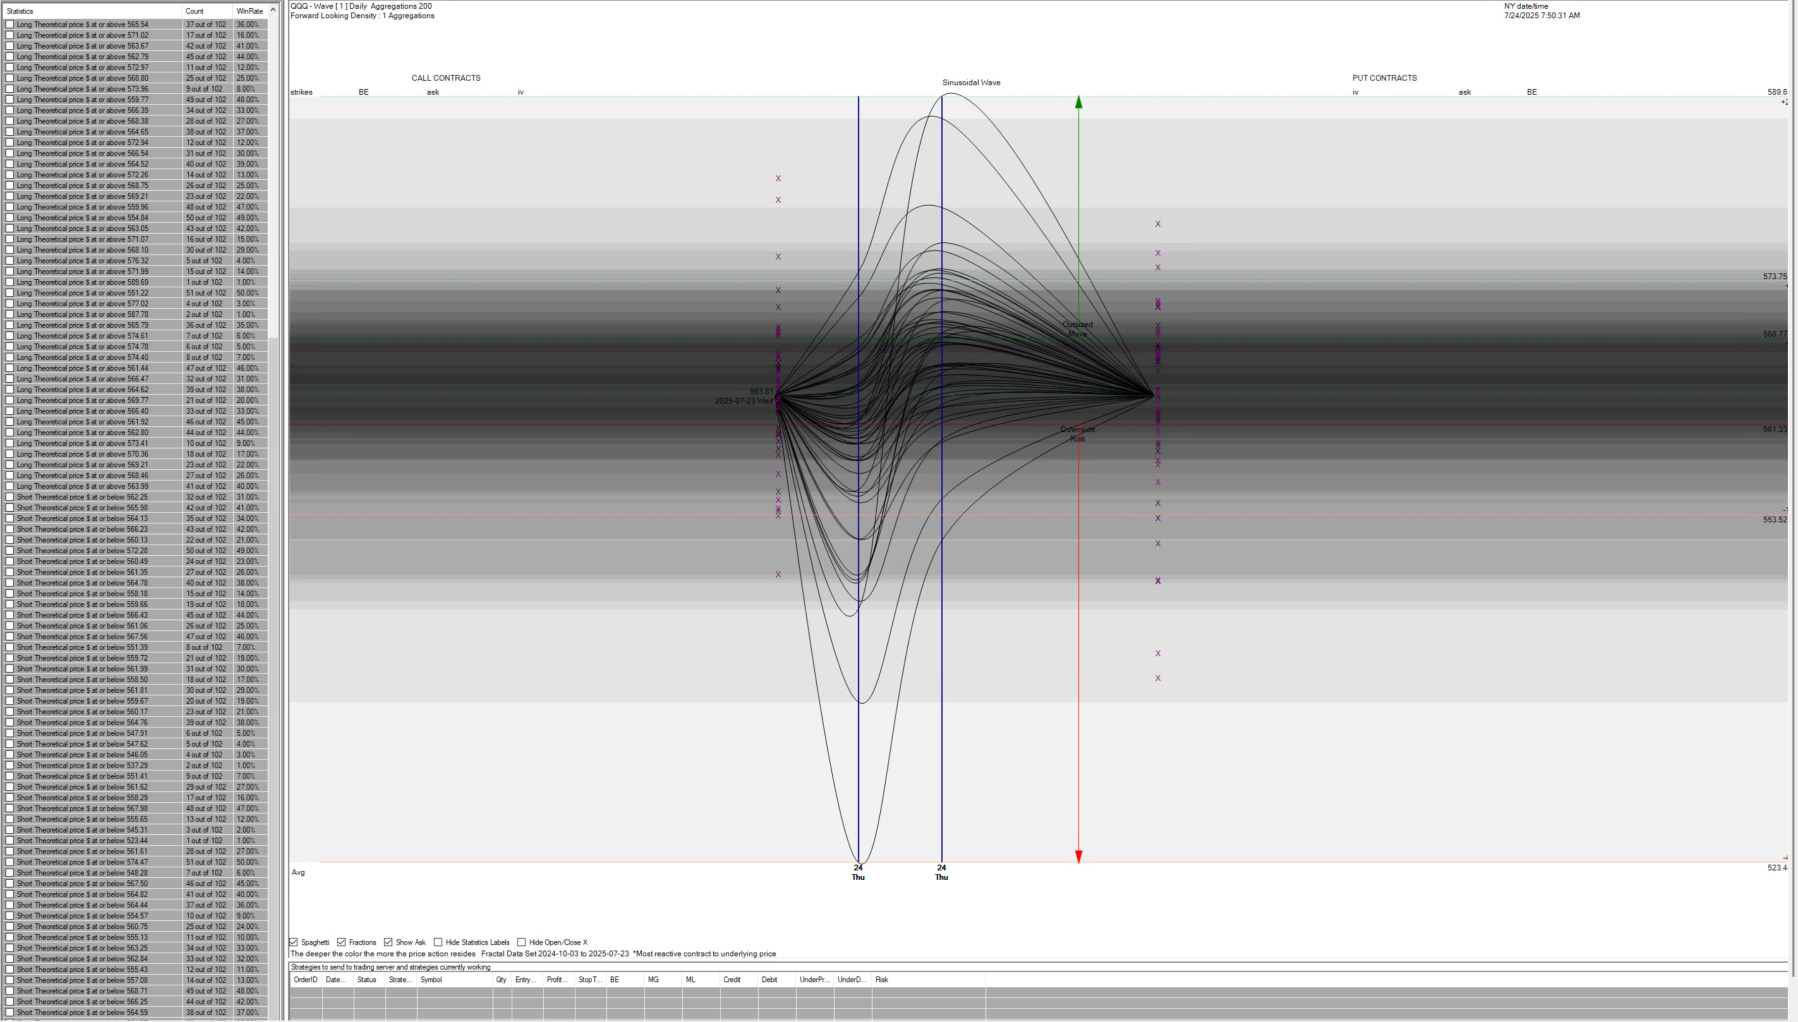
Density Graphs (below): Visualize the forward-looking “paths” that price can take according to different scenarios.
Options Flow Visualization: Aggregates single-day or multi-day options data to reveal where market makers are positioning (so not gamma exposure, much much better).

Practical Applications
HL Matching vs Weekday Matching: Lean into the one with more data, but look at both for confluence.
Reversion Trades: Identify very low probability areas for outlier moves and what scenarios entail them.
Scenario Analysis: Identify “density” lines or “price paths” that are close to where price opens for NY session to see where it can go for high and low of day and with what probability.
IV Strategy: Use the density graphs to map out “IV peak zones” and “walls” which are a killer pair for a Fractal-based strategy, especially when used with the OMM tool (shown below) for entry identification.

First Steps in Your Routine
Open the Spread Monster dashboard pre-market.
Note HL vs. weekday probabilities/ranges.
Identify top 2–3 probability targets with probabilities above 80% (High At/Above + '“Low At/Above”.
Cross-reference with Vector, Open States, and OMM tool for alignment.
Why This Matters
Data-driven probability insights replace guesswork and emotion. By visualizing potential outcomes, Fractal traders can make disciplined decisions, avoiding the common trap of "hoping" for a move.
What’s Next
Ready to let probabilities guide your trading edge? The Spread Monster is your statistical compass.
Confirmed, spread monster is confusing and difficult but its value will pay itself off immensely once I learn, will take me time but I will conquer the spread monster.